The temperature dependence of the acid-catalysed hydrolysis of penicillin is investigated. This is a first order...
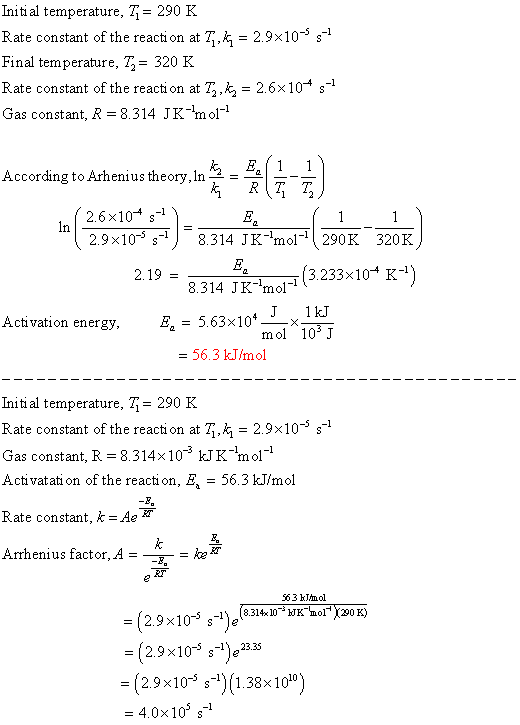
The temperature dependence of the acid-catalysed hydrolysis of penicillin is investigated. This is a first order reaction that only depends on the concentration of the penicillin. The dependence of the rate constant, k, as a function of temperature is given in the following table:
| Temperature (K) | k(s-1) |
| 290 | 2.9e-5 |
| 320 | 2.61e-4 |
Determine the activation energy of this reaction. Express your answer in kJ mol-1 to the first decimal place (XX.X).
Determine the Arrhenius pre-factor, A for this reaction. Express your answer in s-1 to three significant figures (X.XXEX).
Homework Answers
Add Answer to:
The temperature dependence of the acid-catalysed hydrolysis of
penicillin is investigated. This is a first order...
The temperature dependence of the acid-catalysed hydrolysis of penicillin is investigated. This is a first order...
 The temperature dependence of the acid-catalysed hydrolysis of penicillin is investigated. This is a first order reaction that only depends on the concentration of the penicillin. The dependence of the rate constant, k, as a function of temperature is given in the following table: Data Temperature Irek (51) - (K) 285 1.42e – 4 316 0.00138 Determine the activation energy of this reaction. Express your answer in kJ mol-' to the first decimal place (XX.X). 55.0 Your last answer was...
2018 CHEM 361A-01 17273 ard / My courses / Fall 2018 CHEM 361A-01 17273/ Lecture 16...
 2018 CHEM 361A-01 17273 ard / My courses / Fall 2018 CHEM 361A-01 17273/ Lecture 16 0113)-Temperature Dependence of Rate on 1 emaining The temperature dependence of the acid-catalysed hydrolysis of peniclin is investigated. This s a first order reaction that only depends on the concentration of the penicilin. The dependence of the rate constant, K as a function of temperature is gven in the folowing table out of lag ion Data Temperature (K) 289 310 k (s) 0.00244 0.00973...
14.5 The Effect of Temperature on Reaction Rate The following data show the rate constant of...
14.5 The Effect of Temperature on Reaction Rate The following data show the rate constant of a reaction measured at several different temperatures. Temperature (K) Rate Constant (1/s) 310 0.813 320 2.21 330 5.66 340 13.7 350 31.5 Question 10A: Use an Arrhenius plot to determine the activation barrier for the reaction. Express your answer using three significant figures. Answer in kJ/mol Question 10B: Use an Arrhenius plot to determine the frequency factor for the reaction. Express your answer using...
The following data show the rate constant of a reaction measured at several different temperatures. Temperature...
The following data show the rate constant of a reaction measured at several different temperatures. Temperature (K) Rate Constant (1/s) 300 1.19×10⁻² 310 3.64×10⁻² 320 0.104 330 0.278 340 0.703 Part A Part complete Use an Arrhenius plot to determine the activation barrier for the reaction. Express your answer using three significant figures. -- SubmitPrevious AnswersRequest Answer Part B Part complete Use an Arrhenius plot to determine frequency factor for the reaction. Express your answer using two significant figures. --...
The following data show the rate constant of a reaction measured at several different temperatures. Temperature...
The following data show the rate constant of a reaction measured at several different temperatures. Temperature (K)(K) Rate Constant (1/s)(1/s) 310 0.923 320 2.50 330 6.38 340 15.4 350 35.3 Part A Use an Arrhenius plot to determine the activation barrier for the reaction. Express your answer using three significant figures. Part B Use an Arrhenius plot to determine the frequency factor for the reaction. Express your answer using two significant figures.
The following data show the rate constant of a reaction measured at several different temperatures. Temperature...
The following data show the rate constant of a reaction measured at several different temperatures. Temperature (K) Rate Constant (1/s) 310 4.54×10⁻² 320 0.136 330 0.381 340 1.01 350 2.51 Part A Use an Arrhenius plot to determine the activation barrier for the reaction. Express your answer using three significant figures. Part B Use an Arrhenius plot to determine the frequency factor for the reaction. Express your answer using two significant figures.
HIR The following data show the rate constant of a reaction measured at several different temperatures....
 HIR The following data show the rate constant of a reaction measured at several different temperatures. Use an Arrhenius plot to determine the activation barrier for the reaction. Express your answer using three significant figures. 150 ACQ* O ? Temperature (K) Rate Constant (s-1) 310 7.93x10⁻² 320 0.233 330 0.643 340 1.67 4.10 kJ mol-1 350 Submit Request Answer Part B Use an Arrhenius plot to determine the frequency factor for the reaction. Express your answer using two significant figures....
In the investigation of the acid hydrolysis of penicillin as a function of temperature, the following...
In the investigation of the acid hydrolysis of penicillin as a function of temperature, the following data were obtained: T, °C k, s-1 22,2 7,0 x 10⁻⁴ 27,2 9,8 x 10⁻⁴ 33,7 1,6 x 10⁻³ 38,0 2,0 x 10⁻³ calculate and interpret , half-life at 25 ° C
You may want to reference (Pages 606- 612) Section 14.6 while completing this problem. The following...
 You may want to reference (Pages 606- 612) Section 14.6 while completing this problem. The following data show the rate constant of a reaction measured at several different temperatures PartA Temperature (K) Rate constant (1/s) 300 310 320 330 340 1.61x10⁻² 4.90x10⁻² 0.139 0.370 0.931 Use an Arrhenius plot to determine the activation barrier (Ea) for the reaction Express your answer using three significant figures. kJ/mol Submit Part B Use an Arrhenius plot to determine the frequency factor (A) for...
Variation of the rate constant with temperature for the first-order reaction 2N2(g) + O(g) → 2N2O4(g)...
Variation of the rate constant with temperature for the first-order reaction 2N2(g) + O(g) → 2N2O4(g) is given in the following table. Determine the activation energy and pre-exponential factor for the reaction. What would be the rate constant at 350 K? Temperature / K Rate Constant / s-1 273 7.87 x 10³ 298 3.46 x 10⁵ 318 4.98 x 10⁶ 338 4.87 x 10⁷ What is the activation energy in kJ/mol? Do not enter the units with your answer. What...
 The temperature dependence of the acid-catalysed hydrolysis of penicillin is investigated. This is a first order reaction that only depends on the concentration of the penicillin. The dependence of the rate constant, k, as a function of temperature is given in the following table: Data Temperature Irek (51) - (K) 285 1.42e – 4 316 0.00138 Determine the activation energy of this reaction. Express your answer in kJ mol-' to the first decimal place (XX.X). 55.0 Your last answer was...
 2018 CHEM 361A-01 17273 ard / My courses / Fall 2018 CHEM 361A-01 17273/ Lecture 16 0113)-Temperature Dependence of Rate on 1 emaining The temperature dependence of the acid-catalysed hydrolysis of peniclin is investigated. This s a first order reaction that only depends on the concentration of the penicilin. The dependence of the rate constant, K as a function of temperature is gven in the folowing table out of lag ion Data Temperature (K) 289 310 k (s) 0.00244 0.00973...
 HIR The following data show the rate constant of a reaction measured at several different temperatures. Use an Arrhenius plot to determine the activation barrier for the reaction. Express your answer using three significant figures. 150 ACQ* O ? Temperature (K) Rate Constant (s-1) 310 7.93x10⁻² 320 0.233 330 0.643 340 1.67 4.10 kJ mol-1 350 Submit Request Answer Part B Use an Arrhenius plot to determine the frequency factor for the reaction. Express your answer using two significant figures....
 You may want to reference (Pages 606- 612) Section 14.6 while completing this problem. The following data show the rate constant of a reaction measured at several different temperatures PartA Temperature (K) Rate constant (1/s) 300 310 320 330 340 1.61x10⁻² 4.90x10⁻² 0.139 0.370 0.931 Use an Arrhenius plot to determine the activation barrier (Ea) for the reaction Express your answer using three significant figures. kJ/mol Submit Part B Use an Arrhenius plot to determine the frequency factor (A) for...
Most questions answered within 3 hours.
-
Consider the reaction, C3 H8 + O2 --> CO2 + H2O. How many
moles of O2...
asked 1 hour ago -
You and your opponent both roll a fair die. If you both roll the
same number,...
asked 1 hour ago -
In a study of the accuracy of fast food drive-through orders,
Restaurant A had 257 accurate...
asked 1 hour ago -
Identify and describe in detail the four categories of
institutions that could be included in a...
asked 1 hour ago -
In python
class Customer:
def __init__(self, customer_id, last_name, first_name, phone_number, address):
self._customer_id = int(customer_id)
self._last_name =...
asked 1 hour ago -
What is an example of a limitation in implementing a new
ERP system and how it...
asked 1 hour ago -
In a section of 9.7cm of an artery with a radius of 2.6mm there
is a...
asked 1 hour ago -
the two carboxylic acid groups of aspartic acid have different
acidities with pKa values of 2.1...
asked 1 hour ago -
Would CuCO3 aqueous salt combined with calcium chloride
form a solid precipitate? If so, what would...
asked 1 hour ago -
How do ECM Solutions assist in embedding a culture of continuous
improvement in an organization? (Project...
asked 1 hour ago -
Directions
These directions introduce the idea of Essential Questions.
Since this may be a new concept...
asked 1 hour ago -
1.b. Fiscal policy is said to suffer from ‘crowding out’.
Explain what this means and why...
asked 2 hours ago