
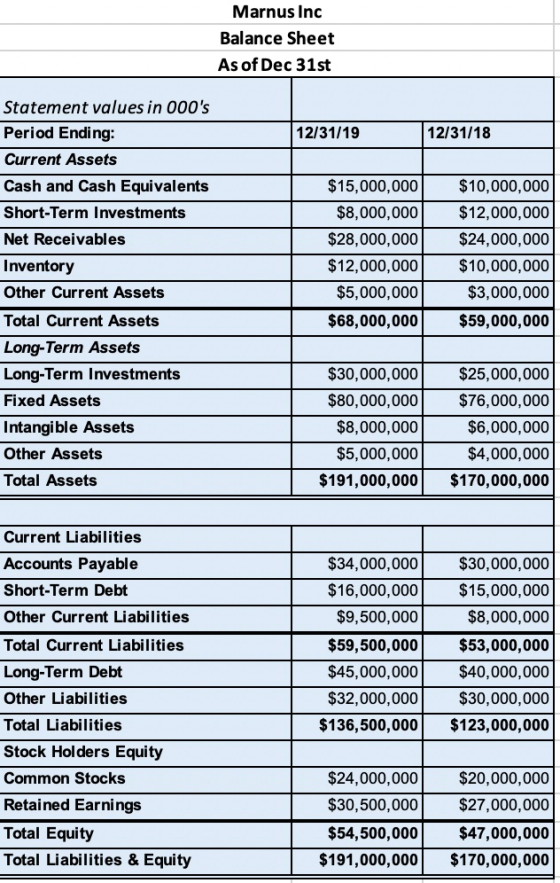
Calculate the RATIO of the following:
![Tests of Solvency 14. Times interest earned ratio - ([Net Income + Interest Expense + Income Tax Expenses] / Interest Expense](http://img.homeworklib.com/questions/6dfb2ed0-73c9-11ea-bef3-c7f1560568d0.png?x-oss-process=image/resize,w_560)
Homework Answers


Add Answer to:
Calculate the RATIO of the following:
Marnus Inc Income Statement For the Financial Year ended 12/31/19...
Calculate the ratio of the following: Marnus Inc Income Statement For the Financial Year ended 12/31/19...
 Calculate the ratio of the following:
Marnus Inc Income Statement For the Financial Year ended 12/31/19 $150,000,000 ($130,000,000) $20,000,000 12/31/18 $140,000,000 ($123,000,000) $17,000,000 $9,000,000 $10,000,000 Statement values in 000's Period Ending: Total Revenue (Net Revenue) Cost of Revenue (COGS) Gross Profit Operating Expenses Sales, General and Admin. Other Operating Items Total Operating Exp Operating Income (or loss) Interest Expense Earnings Before Tax Income Tax Net Income (or loss) $0 $0 | ($9,000,000) $11,000,000 ($1,000,000) $10,000,000 ($5,000,000) $5,000,000 ($10,000,000) $7,000,000 ($800,000)...
Calculate the ratio of the following:
Marnus Inc Income Statement For the Financial Year ended 12/31/19 $150,000,000 ($130,000,000) $20,000,000 12/31/18 $140,000,000 ($123,000,000) $17,000,000 $9,000,000 $10,000,000 Statement values in 000's Period Ending: Total Revenue (Net Revenue) Cost of Revenue (COGS) Gross Profit Operating Expenses Sales, General and Admin. Other Operating Items Total Operating Exp Operating Income (or loss) Interest Expense Earnings Before Tax Income Tax Net Income (or loss) $0 $0 | ($9,000,000) $11,000,000 ($1,000,000) $10,000,000 ($5,000,000) $5,000,000 ($10,000,000) $7,000,000 ($800,000)...
Marnus Inc Income Statement For the Financial Year ended Statement values in 000's Period Ending: 12/31/19...
 Marnus Inc Income Statement For the Financial Year ended Statement values in 000's Period Ending: 12/31/19 12/31/18 Total Revenue (Net Revenue) $150,000,000 $140,000,000 Cost of Revenue (CoGS) ($130,000,000) ($123,000,000) $20,000,000 $17,000,000 Gross Profit Operating Expenses Sales, General and Admin. $9,000,000 $10,000,000 $0 $0 Other Operating Items Total Operating Exp ($9,000,000) ($10,000,000) $11,000,000 $7,000,000 Operating Income (or loss) Interest Expense ($1,000,000) ($800,000) $10,000,000 $6,200,000 Earnings Before Tax ($4,000,000) ($5,000,000) Income Tax Net Income (or loss) $5,000,000 $2,200,000 12/31/19 12/31/18 Dividends declared...
Income Statement Balance Sheet Sales $20,000,000 Assets: Cost of Goods Sold 8.000.000 Cash $ 5,000,000 12,000,000...
 Income Statement Balance Sheet Sales $20,000,000 Assets: Cost of Goods Sold 8.000.000 Cash $ 5,000,000 12,000,000 Marketable Securities 12,500,000 Selling and Administrative 1,600,000 Accounts Receivable, net 2,500,000 Depreciation Expense 3.000.000 Inventory 30,000,000 7,400,000 Prepaid Expenses 5,000,000 Interest 2.000.000 Plant & Equipment 30.000.000 5,400,000 Taxes (25%) 1.350.000 Total Assets 85,000,000 4,050,000 Common Stock Div. 600,000 Liabilities and Equity $3,450,000 Accounts Payable $20,000,000 Notes Payable 5,000,000 Accrued Expenses 5,000,000 Bonds Payable 25,000,000 Common Stock 5,000,000 Capital in Excess of Par 10,000,000 Retained...
P3-19 Common-size statement analysis A common-size income statement for Creek Enterprises 2018 operations follows. Using the...
 P3-19 Common-size statement analysis A common-size income statement for Creek Enterprises 2018 operations follows. Using the firm's 2019 income statement presented in Problem 3-16, develop the 2019 common-size income statement and compare it with the 2018 statement. Which areas require further analysis and investigation? Creek Enterprises Common-Size Income Statement for the Year Ended December 31, 2018 100.0% 65.9 34.1% Sales revenue ($35,000,000) Less: Cost of goods sold Gross profits Less: Operating expenses Selling expense General and administrative expenses Lease expense...
Find FCF, MVA, and EVA. PLEASE SHOW ALL YOUR WORK PLEASE, THANKS. Balance Sheet Income Statement...
 Find FCF, MVA, and EVA. PLEASE SHOW ALL YOUR WORK
PLEASE, THANKS.
Balance Sheet Income Statement Net Sales Operating Cost 6,000,000 Depreciation 1,000,000 EBIT Interest EBT Taxes 40% Net Income 12,000,000 Accounts Payable 3,000,000 1,000,000 2,000,000 6,000,000 5,600,000 17,400,000 29,000,000 Current Assets 14,000,000 Accruals Notes Payable Current Liabilities Long-term Debt Common Equity Total Liabilities and Equity 5,000,000 1,000,000 4,000,000 1,600,000 2,400,000 Net Fixed Assets 15,000,000 Total Assets 29,000,000 Shares Stock Price After Tax Cost of Capital Prior year net fixed...
Find FCF, MVA, and EVA. PLEASE SHOW ALL YOUR WORK
PLEASE, THANKS.
Balance Sheet Income Statement Net Sales Operating Cost 6,000,000 Depreciation 1,000,000 EBIT Interest EBT Taxes 40% Net Income 12,000,000 Accounts Payable 3,000,000 1,000,000 2,000,000 6,000,000 5,600,000 17,400,000 29,000,000 Current Assets 14,000,000 Accruals Notes Payable Current Liabilities Long-term Debt Common Equity Total Liabilities and Equity 5,000,000 1,000,000 4,000,000 1,600,000 2,400,000 Net Fixed Assets 15,000,000 Total Assets 29,000,000 Shares Stock Price After Tax Cost of Capital Prior year net fixed...
1) Based on the balance sheet and income statement information given below, calculate the following financial...
 1) Based on the balance sheet and income statement information
given below, calculate the following financial ratios and explain
briefly what the number you calculated means:
a) Current ratio
b) Acid-test ratio
c) Days in receivables
d) Debt ratio
e) Return on equity
Assets: Cash and marketable securities Accounts receivable Inventories Prepaid expenses Total current assets Fixed assets Less: accum. depr. Net fixed assets Total assets $600,000 900,000 1,500,000 75,000 $3,075,000 8,000,000 (2,075,000) $5,925,000 $9,000,000 Liabilities: Accounts payable Notes payable...
1) Based on the balance sheet and income statement information
given below, calculate the following financial ratios and explain
briefly what the number you calculated means:
a) Current ratio
b) Acid-test ratio
c) Days in receivables
d) Debt ratio
e) Return on equity
Assets: Cash and marketable securities Accounts receivable Inventories Prepaid expenses Total current assets Fixed assets Less: accum. depr. Net fixed assets Total assets $600,000 900,000 1,500,000 75,000 $3,075,000 8,000,000 (2,075,000) $5,925,000 $9,000,000 Liabilities: Accounts payable Notes payable...
(b) The following financial statement is for the current year. From the past, you know that...
 (b) The following financial statement is for the current year. From the past, you know that 10% of fixed-rate mortgages prepay each year. You also estimate that 10% of checkable deposits and 20% of savings accounts are rate sensitive. Assets (RM) 15,000,000 5,500,000 Reserves Securities < 1 year 1 to 2 years >2 years 8,000,000 Residential Mortgages Variables-rate Fixed-rate Liabilities (RM) 1,500,000 Checkable Deposits Money Market 6,000,000 Deposits 8,000,000 Savings Accounts 12,000,000 CDs Variables-rate <1 year 7,000,000 1 to 2...
Table 4-6 Sample Balance Sheet 2018 2019 7,000,000 9,000,000 Current assets Total fixed assets Total assets...
 Table 4-6 Sample Balance Sheet 2018 2019 7,000,000 9,000,000 Current assets Total fixed assets Total assets 8,000,000 15,000,000 6,000,000 15,000,000 Current liabilities Long term debt 3,000,000 4,000,000 1,000,000 4,000,000 Owner's equity 8,000,000 10,000,000 Total liabilities & owner's equity 15.000.000 15.000.000 3.Based on the Balance Sheet Below on Table 4-6, Calculate the following for each year: 2018 Current Ratio: Debt-to-Asset Ratio: 2019 Current Ratio: Debt-to-Asset Ratio: B.Explain what each of these ratios mean. Did they improve or decline from 2018 to...
Stargel Inc. Comparative Income Statement For the Years Ended December 31, 20Y2 and 20Y1 20Y2 20Y1...
Stargel Inc. Comparative Income Statement For the Years Ended December 31, 20Y2 and 20Y1 20Y2 20Y1 Sales $10,000,000 $9,400,000 Cost of goods sold (5,350,000) (4,950,000) Gross profit $4,650,000 $4,450,000 Selling expenses $(2,000,000) $(1,880,000) Administrative expenses (1,500,000) (1,410,000) Total operating expenses $(3,500,000) $(3,290,000) Operating income $1,150,000 $1,160,000 Other revenue and expense: Other revenue 150,000 140,000 Other expense (interest) (170,000) (150,000) Income before income tax expense $1,130,000 $1,150,000 Income tax expense (230,000) (225,000) Net income $900,000 $925,000 Stargel Inc. Comparative Balance Sheet...
 Calculate the ratio of the following:
Marnus Inc Income Statement For the Financial Year ended 12/31/19 $150,000,000 ($130,000,000) $20,000,000 12/31/18 $140,000,000 ($123,000,000) $17,000,000 $9,000,000 $10,000,000 Statement values in 000's Period Ending: Total Revenue (Net Revenue) Cost of Revenue (COGS) Gross Profit Operating Expenses Sales, General and Admin. Other Operating Items Total Operating Exp Operating Income (or loss) Interest Expense Earnings Before Tax Income Tax Net Income (or loss) $0 $0 | ($9,000,000) $11,000,000 ($1,000,000) $10,000,000 ($5,000,000) $5,000,000 ($10,000,000) $7,000,000 ($800,000)...
Calculate the ratio of the following:
Marnus Inc Income Statement For the Financial Year ended 12/31/19 $150,000,000 ($130,000,000) $20,000,000 12/31/18 $140,000,000 ($123,000,000) $17,000,000 $9,000,000 $10,000,000 Statement values in 000's Period Ending: Total Revenue (Net Revenue) Cost of Revenue (COGS) Gross Profit Operating Expenses Sales, General and Admin. Other Operating Items Total Operating Exp Operating Income (or loss) Interest Expense Earnings Before Tax Income Tax Net Income (or loss) $0 $0 | ($9,000,000) $11,000,000 ($1,000,000) $10,000,000 ($5,000,000) $5,000,000 ($10,000,000) $7,000,000 ($800,000)...
 Marnus Inc Income Statement For the Financial Year ended Statement values in 000's Period Ending: 12/31/19 12/31/18 Total Revenue (Net Revenue) $150,000,000 $140,000,000 Cost of Revenue (CoGS) ($130,000,000) ($123,000,000) $20,000,000 $17,000,000 Gross Profit Operating Expenses Sales, General and Admin. $9,000,000 $10,000,000 $0 $0 Other Operating Items Total Operating Exp ($9,000,000) ($10,000,000) $11,000,000 $7,000,000 Operating Income (or loss) Interest Expense ($1,000,000) ($800,000) $10,000,000 $6,200,000 Earnings Before Tax ($4,000,000) ($5,000,000) Income Tax Net Income (or loss) $5,000,000 $2,200,000 12/31/19 12/31/18 Dividends declared...
 Income Statement Balance Sheet Sales $20,000,000 Assets: Cost of Goods Sold 8.000.000 Cash $ 5,000,000 12,000,000 Marketable Securities 12,500,000 Selling and Administrative 1,600,000 Accounts Receivable, net 2,500,000 Depreciation Expense 3.000.000 Inventory 30,000,000 7,400,000 Prepaid Expenses 5,000,000 Interest 2.000.000 Plant & Equipment 30.000.000 5,400,000 Taxes (25%) 1.350.000 Total Assets 85,000,000 4,050,000 Common Stock Div. 600,000 Liabilities and Equity $3,450,000 Accounts Payable $20,000,000 Notes Payable 5,000,000 Accrued Expenses 5,000,000 Bonds Payable 25,000,000 Common Stock 5,000,000 Capital in Excess of Par 10,000,000 Retained...
 P3-19 Common-size statement analysis A common-size income statement for Creek Enterprises 2018 operations follows. Using the firm's 2019 income statement presented in Problem 3-16, develop the 2019 common-size income statement and compare it with the 2018 statement. Which areas require further analysis and investigation? Creek Enterprises Common-Size Income Statement for the Year Ended December 31, 2018 100.0% 65.9 34.1% Sales revenue ($35,000,000) Less: Cost of goods sold Gross profits Less: Operating expenses Selling expense General and administrative expenses Lease expense...
 Find FCF, MVA, and EVA. PLEASE SHOW ALL YOUR WORK
PLEASE, THANKS.
Balance Sheet Income Statement Net Sales Operating Cost 6,000,000 Depreciation 1,000,000 EBIT Interest EBT Taxes 40% Net Income 12,000,000 Accounts Payable 3,000,000 1,000,000 2,000,000 6,000,000 5,600,000 17,400,000 29,000,000 Current Assets 14,000,000 Accruals Notes Payable Current Liabilities Long-term Debt Common Equity Total Liabilities and Equity 5,000,000 1,000,000 4,000,000 1,600,000 2,400,000 Net Fixed Assets 15,000,000 Total Assets 29,000,000 Shares Stock Price After Tax Cost of Capital Prior year net fixed...
Find FCF, MVA, and EVA. PLEASE SHOW ALL YOUR WORK
PLEASE, THANKS.
Balance Sheet Income Statement Net Sales Operating Cost 6,000,000 Depreciation 1,000,000 EBIT Interest EBT Taxes 40% Net Income 12,000,000 Accounts Payable 3,000,000 1,000,000 2,000,000 6,000,000 5,600,000 17,400,000 29,000,000 Current Assets 14,000,000 Accruals Notes Payable Current Liabilities Long-term Debt Common Equity Total Liabilities and Equity 5,000,000 1,000,000 4,000,000 1,600,000 2,400,000 Net Fixed Assets 15,000,000 Total Assets 29,000,000 Shares Stock Price After Tax Cost of Capital Prior year net fixed...
 1) Based on the balance sheet and income statement information
given below, calculate the following financial ratios and explain
briefly what the number you calculated means:
a) Current ratio
b) Acid-test ratio
c) Days in receivables
d) Debt ratio
e) Return on equity
Assets: Cash and marketable securities Accounts receivable Inventories Prepaid expenses Total current assets Fixed assets Less: accum. depr. Net fixed assets Total assets $600,000 900,000 1,500,000 75,000 $3,075,000 8,000,000 (2,075,000) $5,925,000 $9,000,000 Liabilities: Accounts payable Notes payable...
1) Based on the balance sheet and income statement information
given below, calculate the following financial ratios and explain
briefly what the number you calculated means:
a) Current ratio
b) Acid-test ratio
c) Days in receivables
d) Debt ratio
e) Return on equity
Assets: Cash and marketable securities Accounts receivable Inventories Prepaid expenses Total current assets Fixed assets Less: accum. depr. Net fixed assets Total assets $600,000 900,000 1,500,000 75,000 $3,075,000 8,000,000 (2,075,000) $5,925,000 $9,000,000 Liabilities: Accounts payable Notes payable...
 (b) The following financial statement is for the current year. From the past, you know that 10% of fixed-rate mortgages prepay each year. You also estimate that 10% of checkable deposits and 20% of savings accounts are rate sensitive. Assets (RM) 15,000,000 5,500,000 Reserves Securities < 1 year 1 to 2 years >2 years 8,000,000 Residential Mortgages Variables-rate Fixed-rate Liabilities (RM) 1,500,000 Checkable Deposits Money Market 6,000,000 Deposits 8,000,000 Savings Accounts 12,000,000 CDs Variables-rate <1 year 7,000,000 1 to 2...
 Table 4-6 Sample Balance Sheet 2018 2019 7,000,000 9,000,000 Current assets Total fixed assets Total assets 8,000,000 15,000,000 6,000,000 15,000,000 Current liabilities Long term debt 3,000,000 4,000,000 1,000,000 4,000,000 Owner's equity 8,000,000 10,000,000 Total liabilities & owner's equity 15.000.000 15.000.000 3.Based on the Balance Sheet Below on Table 4-6, Calculate the following for each year: 2018 Current Ratio: Debt-to-Asset Ratio: 2019 Current Ratio: Debt-to-Asset Ratio: B.Explain what each of these ratios mean. Did they improve or decline from 2018 to...
Most questions answered within 3 hours.
-
(2) For the following questions, consider a data set that
exhibits a normal distribution. Report the...
asked 1 minute ago -
What exactly is an information system? How does it work" What
are its people organization,
...
asked 2 minutes ago -
The Food Marketing Institute shows that 17% of households spend
more than $100 per week on...
asked 12 minutes ago -
Go to NCBI BLAST search web page
1st search: GEKDLRRAKDINQEVYNF
2nd search: PTSQRLQLLEPFDK
3rd search: GEKDLRRAKDINQEVYNF...
asked 15 minutes ago -
Explain how each of the following three conditions could be a
red flag for a register...
asked 20 minutes ago -
In a two-way factorial ANOVA, the final F-ratio for
factor AxB is determined by dividing _____...
asked 51 minutes ago -
Show your solutions for answer.
4. An aqueous solution contains 9.21 g of
K4Fe(CN)6 in a...
asked 20 minutes ago -
The random variable X has a uniform distribution with values
between 16 and 18. What is...
asked 30 minutes ago -
Evaluate each of the following transactions in terms of their
effect on assets, liabilities, and equity....
asked 29 minutes ago -
The amounts of nicotine in a certain brand of cigarette are
normally distributed with a mean...
asked 49 minutes ago -
The commercial lending department of First Bank made a
substantial loan to Alpha Company after obtaining...
asked 35 minutes ago -
For a reaction, reagents --->products, it's forwarding rate
(rate of products formation) is proportional to the...
asked 48 minutes ago