17) Graphically derive the IS curve from the goods market equilibrium. What is the IS relation?...
17) Graphically derive the IS curve from the goods market equilibrium. What is the IS relation? Explain why IS curve is downward sloping.
18) Explain in detail and graph what effect a reduction in government spending will have on: (1) the LM curve; and (2) the IS curve.
Homework Answers
17,
The real sector equilibrium and the derivation of IS curve
For simplicity we start our analysis with a closed economy in which there is no government. In the Keynesian model, the equilibrium level of employment and output is determined by the level of effective aggregate demand. Aggregate demand consists of connsumption and investment. E=C + I. The households dispose off their incomeeither by consuming or saving i.e, Y=C + S. For static flow equilibrium in the real sector, we must have aggregate supply equals aggregate demand for it or S = I.
Savings are assumed to depend positively on the level of income S=f(Y). The savings function is the counterpart of the consumption function C= -a+(+b)y. Investment is inversely dependent on the rate of interest. A crucial determinant of investment in the Keynesian model is expectations about the fututre (MEC) in the ISLM model expectations are given such that I=f( MEC,r).
The derivation of the IS curve is explained below,

The quadrant 1 of the diagram the income - savings relationship. At y1 level of income savings is s1.
It is transferred to the verical axis in quadrant 2, there shows the savings - investment equilibrium. The 450 line converts the distance into equal between horizontal and vertical axis.
The investment schedule in quadrant 3 shows that the rate of interest must be 'r1' to result in a level of investment I1.
The co-ordinate of 'y1' and 'r1' is then plotted in quadrant 4. Then we have one combination of income and rate of interest at which savings equals investment (S = I). The same process is repeated for income level y2 to obtain interest rate 'r2' which makes S =I. In this way we obtain a large number of interest rates and output levels at which S =I and by joining them we obtain the IS curve.
The slope of IS curve
The IS curve slopes downwards from left to right. It shows a high rate of interest and a low level of income or a low rate of interest and a high level of income. As the rate of interest falls, investment increases and so does income and savings. Conversely, a high rate of interest, which reduces investment , has to be balanced by a low income, which reduces savings. The slope of the IS curve depends on the interest elasticity of investment.
(If the investment demand functions is less interest elastic, the IS curve will be steeper. On the other hand, more the interest elasticity of investment, the IS curve will be flatter. In the limiting case where investment is perfectly interest inelastic, IS curve is vertical.)
18,
Reduction in government spending on IS and LM curves
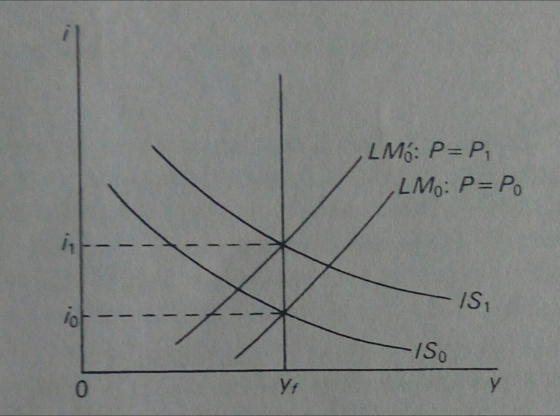
A reduction in government spending or an increase in taxation would have the effects of shifting IS curve from IS1 to IS0. the price level would fall, shifting the LM schedule down from LM10: P=P1 to LM0 : P = P0 and the interest rate would fall.
Add Answer to:
17) Graphically derive the IS curve from the goods market
equilibrium. What is the IS relation?...
a) Using the Keynesian cross model where the goods market equilibrium is determined and analyzed, graphically...
a) Using the Keynesian cross model where the goods market equilibrium is determined and analyzed, graphically derive the IS curve, and explain each step. Explain what the equilibrium in the goods market implies for the IS curve, i.e., why is the IS curve downward sloping. Also, explain what causes shifts in the IS curve b) First, based on the analysis of the financial market equilibrium, graphically derive the LM curve. Explain what the LM curve is and explain in detail...
Q1140 points] Briefly, but not unsatisfactorily, answer the following questions. a) Using the Key...
 Q1140 points] Briefly, but not unsatisfactorily, answer the following questions. a) Using the Keynesian cross model where the goods market equilibrium is determined and analyzed, graphically derive the IS curve, and explain each step. Explain what the equilibrium in the goods market implies for the IS curve, i.e., why is the IS curve downward sloping. Also, explain what causes shifts in the IS curve. b) First, based on the analysis of the financial market equilibrium, graphically derive the LM curve....
Financial markets and the LM relation. a) Explain why the money demand curve is downward sloping...
 Financial markets and the LM relation. a) Explain why the money demand curve is downward sloping and what b) What types of policies can the central bank implement to reduce the interest c) Define the velocity of money. What effect does an increase in interest rate d) Illustrate graphically the effect of a drop in nominal income on the money e) Illustrate graphically the effect of a purchase of bonds by the Federal Reserve factor(s) cause shifts in the money...
Starting with a graph of the goods market and progressing using the IS-LM diagram show graphically...
Starting with a graph of the goods market and progressing using the IS-LM diagram show graphically and explain how an increase in government spending affects overall macroeconomic equilibrium.
Assume the following equations for the goods and money market of an economy: C = 250...
Assume the following equations for the goods and money market of an economy: C = 250 + .8(Y-T) I = 100 - 50r T = G = 100. Ms = 200 Md = 0.2Y – 100r a) Write the equation of the IS curve for this economy. Is this upward or downward sloping? The IS curve is written as Y = _ +/- _r. (6 points) b) If T falls to 50 and everything else remains the same, write the...
1. Use the Keynesian cross model and show graphically in which direction will equilibrium level of...
1. Use the Keynesian cross model and show graphically in which direction will equilibrium level of income (or output) change. For each of the following, write down the formula for the size of the change of income (i.e. write down the formula for ∆Y): (i) An increase in government purchases (ii) An increase in taxes (iii) An increase in government purchase and an increase in taxes of equal amount (Nb: You must draw a SEPARATE graph for parts (i) and...
Recall the IS-LM model. In particular, the goods-market equilibrium condition was Y = C (Y −...
Recall the IS-LM model. In particular, the goods-market equilibrium condition was Y = C (Y − T ) + I (r) + G, and the money-market equilibrium condition was m = L (r, Y ). Here, the exogenous variables are G (government spending), T (taxes), and m (real money supply). The endogenous variables are Y (output, or income) and r (real interest rate). C (·) is the consumption function, which is increasing in disposable income Y − T , but...
You are given the following information about an economy(interest rate is measured in percentage points). A...
 You
are given the following information about an economy(interest rate
is measured in percentage points). A five percent interest is r =
5.
1. You are given the following information about an economy (note: the interest rate is measured in percentage points. A five percent interest is r5): (M/P) = 100 (M/P)"=0.2 Y - 10 C = 150+ 0.667 YD-10 I=200 - 10r + 0.1 Y G=200 NX = 50 | T = 0.25 Y YD = Y-T A. (i)...
You
are given the following information about an economy(interest rate
is measured in percentage points). A five percent interest is r =
5.
1. You are given the following information about an economy (note: the interest rate is measured in percentage points. A five percent interest is r5): (M/P) = 100 (M/P)"=0.2 Y - 10 C = 150+ 0.667 YD-10 I=200 - 10r + 0.1 Y G=200 NX = 50 | T = 0.25 Y YD = Y-T A. (i)...
1. Show how to derive the IS curve as we specified in the class. Show all...
 1. Show how to derive the IS curve as we specified in the class. Show all the necessary steps (from the very beginning) to derive the IS curve. Draw a graph of the IS curve as well. What is the slope of the IS curve? What's the intuition of the sign of slope (positive or negative)? Explain clearly. 2. Analyzing macroeconomic events with the IS curve: consider the following events in the macroeconomy. Show how to think about them using...
x Problem set +2 - INTRMOT MAX Microsoft Word - PS232 sp18 X C Consider The Goods Market Mox u/bbcswebdav/pid-...
 x Problem set +2 - INTRMOT MAX Microsoft Word - PS232 sp18 X C Consider The Goods Market Mox u/bbcswebdav/pid-3641779-dt-content-rid-32308594 1/courses/ECON_1054_001_19F/PSX209232 au 19 pdf + 1. Consider first the goods market model with (exogenously given) constant investment Consumption is given by C = c +(Y-T) and T. G, and T are given. a. Solve for equilibrium output. What is the value of the multiplier? Now let investment depend on both sales and the interest rate: I= b + b Y-bi...
 Q1140 points] Briefly, but not unsatisfactorily, answer the following questions. a) Using the Keynesian cross model where the goods market equilibrium is determined and analyzed, graphically derive the IS curve, and explain each step. Explain what the equilibrium in the goods market implies for the IS curve, i.e., why is the IS curve downward sloping. Also, explain what causes shifts in the IS curve. b) First, based on the analysis of the financial market equilibrium, graphically derive the LM curve....
 Financial markets and the LM relation. a) Explain why the money demand curve is downward sloping and what b) What types of policies can the central bank implement to reduce the interest c) Define the velocity of money. What effect does an increase in interest rate d) Illustrate graphically the effect of a drop in nominal income on the money e) Illustrate graphically the effect of a purchase of bonds by the Federal Reserve factor(s) cause shifts in the money...
 You
are given the following information about an economy(interest rate
is measured in percentage points). A five percent interest is r =
5.
1. You are given the following information about an economy (note: the interest rate is measured in percentage points. A five percent interest is r5): (M/P) = 100 (M/P)"=0.2 Y - 10 C = 150+ 0.667 YD-10 I=200 - 10r + 0.1 Y G=200 NX = 50 | T = 0.25 Y YD = Y-T A. (i)...
You
are given the following information about an economy(interest rate
is measured in percentage points). A five percent interest is r =
5.
1. You are given the following information about an economy (note: the interest rate is measured in percentage points. A five percent interest is r5): (M/P) = 100 (M/P)"=0.2 Y - 10 C = 150+ 0.667 YD-10 I=200 - 10r + 0.1 Y G=200 NX = 50 | T = 0.25 Y YD = Y-T A. (i)...
 1. Show how to derive the IS curve as we specified in the class. Show all the necessary steps (from the very beginning) to derive the IS curve. Draw a graph of the IS curve as well. What is the slope of the IS curve? What's the intuition of the sign of slope (positive or negative)? Explain clearly. 2. Analyzing macroeconomic events with the IS curve: consider the following events in the macroeconomy. Show how to think about them using...
 x Problem set +2 - INTRMOT MAX Microsoft Word - PS232 sp18 X C Consider The Goods Market Mox u/bbcswebdav/pid-3641779-dt-content-rid-32308594 1/courses/ECON_1054_001_19F/PSX209232 au 19 pdf + 1. Consider first the goods market model with (exogenously given) constant investment Consumption is given by C = c +(Y-T) and T. G, and T are given. a. Solve for equilibrium output. What is the value of the multiplier? Now let investment depend on both sales and the interest rate: I= b + b Y-bi...
Most questions answered within 3 hours.
-
A (8.5) cm tall object is placed at a distance of (14.2) cm from
a convex...
asked 2 minutes ago -
(2) For the following questions, consider a data set that
exhibits a normal distribution. Report the...
asked 3 minutes ago -
What exactly is an information system? How does it work" What
are its people organization,
...
asked 5 minutes ago -
The Food Marketing Institute shows that 17% of households spend
more than $100 per week on...
asked 14 minutes ago -
Go to NCBI BLAST search web page
1st search: GEKDLRRAKDINQEVYNF
2nd search: PTSQRLQLLEPFDK
3rd search: GEKDLRRAKDINQEVYNF...
asked 18 minutes ago -
Explain how each of the following three conditions could be a
red flag for a register...
asked 23 minutes ago -
In a two-way factorial ANOVA, the final F-ratio for
factor AxB is determined by dividing _____...
asked 53 minutes ago -
Show your solutions for answer.
4. An aqueous solution contains 9.21 g of
K4Fe(CN)6 in a...
asked 23 minutes ago -
The random variable X has a uniform distribution with values
between 16 and 18. What is...
asked 33 minutes ago -
Evaluate each of the following transactions in terms of their
effect on assets, liabilities, and equity....
asked 32 minutes ago -
The amounts of nicotine in a certain brand of cigarette are
normally distributed with a mean...
asked 52 minutes ago -
The commercial lending department of First Bank made a
substantial loan to Alpha Company after obtaining...
asked 38 minutes ago