
Homework Answers

Add Answer to:
4. Hypothesis testing for a Population proportion Write down the null and alternate hypotheses for part...
According to a survey conducted by the Association for Ranch Dressings and Sauces, 20% of American...
According to a survey conducted by the Association for Ranch Dressings and Sauces, 20% of American adults eat pizza once a week. A nutritionist suspects that this percentage is not accurate. She conducts a survey of 700 American adults and finds that 77 of them eat pizza once a week. Use a 0.05 significance level to test the claim that the proportion of American adults who eat pizza once a week is different from 20%. Claim: Opposite: The test is:...
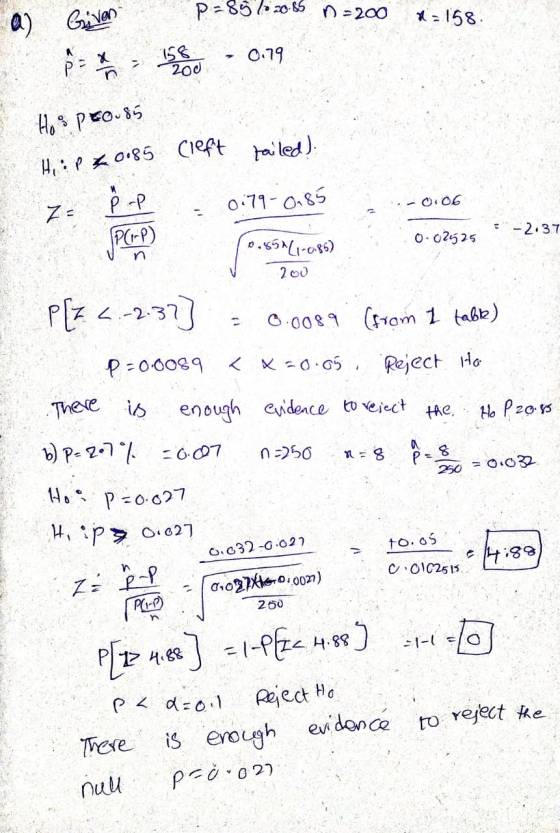
6.16 Is college worth it? Part I: Among a simple random sample of 331 American adults...
6.16 Is college worth it? Part I: Among a simple random sample of 331 American adults who do not have a four-year college degree and are not currently enrolled in school, 48% said they decided not to go to college because they could not afford school. (a) A newspaper article states that only a minority of the Americans who decide not to go to college do so because they cannot afford it and uses the point estimate from this survey...
Among a simple random sample of 331 American adults who do not have a four-year college...
Among a simple random sample of 331 American adults who do not have a four-year college degree and are not currently enrolled in school, 48% said they decided not to go to college because they could not afford school. (a) A newspaper article states that only a minority of the Americans who decide not to go to college do so because they cannot afford it and uses the point estimate from this survey as evidence. Conduct a hypothesis test to...
18. The criterion used for rejecting the null hypothesis is called _____. a. Alternate hypothesis b. ...
18. The criterion used for rejecting the null hypothesis is called _____. a. Alternate hypothesis b. Type I error c. Significance level d. Standard error of the mean 19. The smaller the p value _____. a. The more evidence we should reject the null hypothesis b. The less evidence we should reject the null hypothesis c. The more likely it is that the results are not significant d. Has no relationship with significance 23. Hospital autopsies include which of the...
3) In 2005, 21% of Americans reported that they smoked cigarettes. In a recent study to...
 3) In 2005, 21% of Americans reported that they smoked cigarettes. In a recent study to see if the percentage has changed since 2005, researchers surveyed 2000 Americans where 380 of them responded to the survey as smokers. Does the evidence provided by the recent survey appear to support the claim that the percent of Americans who smoke has changed since 2005 at the 5% significance level? (Circle either Yes or No). YES NO Please show the four steps of...
Stats leab 9.1 Hypothesis Testing of a Single Mean and Single Proportion Class Time: Names: Student...
 Stats leab 9.1 Hypothesis Testing of a Single Mean and Single Proportion Class Time: Names: Student Learning Outcomes • The student will select the appropriate distributions to use in each case. The student will conduct hypothesis tests and interpret the results. Television Survey In a recent survey, it was stated that Americans watch television on average four hours per day. Assume that o = 2. Using your class as the sample, conduct a hypothesis test to determine if the average...
#7, #8, #10 Using and Interpreting Concepts Hypothesis Testing Using Rejection Regions In Exercises 7-1 (a)...
 #7, #8, #10
Using and Interpreting Concepts Hypothesis Testing Using Rejection Regions In Exercises 7-1 (a) identify the claim and state Ho and Ha, (b) find the critical value(s) and identi the rejection region(s), (c) find the standardized test statistic z, (d) decide v to reject or fail to reject the null hypothesis, and (e) interpret the decistion in context of the original claim. 7, Vaccination Requirement A medical researcher says that less than 80% of U.S. adults think that...
#7, #8, #10
Using and Interpreting Concepts Hypothesis Testing Using Rejection Regions In Exercises 7-1 (a) identify the claim and state Ho and Ha, (b) find the critical value(s) and identi the rejection region(s), (c) find the standardized test statistic z, (d) decide v to reject or fail to reject the null hypothesis, and (e) interpret the decistion in context of the original claim. 7, Vaccination Requirement A medical researcher says that less than 80% of U.S. adults think that...
ONLY DO NUMBER 3 For this project you will test claims and conjectures using hypothesis testing. ...
ONLY DO NUMBER 3 For this project you will test claims and conjectures using hypothesis testing. For each hypothesis test, report the following: The null hypothesis, H0 The alternative hypothesis, H1 The test statistic rounded to the nearest hundredth (use T Stats or Proportion Stats in StatCrunch to find test statistics) The P-value for the test (use T Stats or Proportion Stats in StatCrunch to find P-values) The formal decision (Reject H0 or Fail to reject H0, remember that reject...
ONLY DO NUMBER 7 For this project you will test claims and conjectures using hypothesis testing. ...
ONLY DO NUMBER 7 For this project you will test claims and conjectures using hypothesis testing. For each hypothesis test, report the following: The null hypothesis, H0 The alternative hypothesis, H1 The test statistic rounded to the nearest hundredth (use T Stats or Proportion Stats in StatCrunch to find test statistics) The P-value for the test (use T Stats or Proportion Stats in StatCrunch to find P-values) The formal decision (Reject H0 or Fail to reject H0, remember that reject...
Question 21 (4 points) For a hypothesis test about a population proportion or mean, if the...
 Question 21 (4 points) For a hypothesis test about a population proportion or mean, if the level of significance is less than the p- value, the null hypothesis is rejected. (Ch10) True False Question 22 (4 points) Everything else being constant, increasing the sample size decreases the probability of committing a Type II error. (Ch10) True False The power of a statistical test is the probability of not rejecting the null hypothesis when it is true. (Ch10) True False Question...
 3) In 2005, 21% of Americans reported that they smoked cigarettes. In a recent study to see if the percentage has changed since 2005, researchers surveyed 2000 Americans where 380 of them responded to the survey as smokers. Does the evidence provided by the recent survey appear to support the claim that the percent of Americans who smoke has changed since 2005 at the 5% significance level? (Circle either Yes or No). YES NO Please show the four steps of...
 Stats leab 9.1 Hypothesis Testing of a Single Mean and Single Proportion Class Time: Names: Student Learning Outcomes • The student will select the appropriate distributions to use in each case. The student will conduct hypothesis tests and interpret the results. Television Survey In a recent survey, it was stated that Americans watch television on average four hours per day. Assume that o = 2. Using your class as the sample, conduct a hypothesis test to determine if the average...
 #7, #8, #10
Using and Interpreting Concepts Hypothesis Testing Using Rejection Regions In Exercises 7-1 (a) identify the claim and state Ho and Ha, (b) find the critical value(s) and identi the rejection region(s), (c) find the standardized test statistic z, (d) decide v to reject or fail to reject the null hypothesis, and (e) interpret the decistion in context of the original claim. 7, Vaccination Requirement A medical researcher says that less than 80% of U.S. adults think that...
#7, #8, #10
Using and Interpreting Concepts Hypothesis Testing Using Rejection Regions In Exercises 7-1 (a) identify the claim and state Ho and Ha, (b) find the critical value(s) and identi the rejection region(s), (c) find the standardized test statistic z, (d) decide v to reject or fail to reject the null hypothesis, and (e) interpret the decistion in context of the original claim. 7, Vaccination Requirement A medical researcher says that less than 80% of U.S. adults think that...
 Question 21 (4 points) For a hypothesis test about a population proportion or mean, if the level of significance is less than the p- value, the null hypothesis is rejected. (Ch10) True False Question 22 (4 points) Everything else being constant, increasing the sample size decreases the probability of committing a Type II error. (Ch10) True False The power of a statistical test is the probability of not rejecting the null hypothesis when it is true. (Ch10) True False Question...
Most questions answered within 3 hours.
-
I1(t) and I2(t) describe the intensity of two
light waves.
I1(t)= 10sin(30t+π/4)
I2(t)=
10sin(30.4t+π)
Assume that...
asked 1 minute ago -
A sample of steam with a mass of 0.501 g at a temperature of 100
∘C...
asked 7 minutes ago -
A block sits on the floor. (a) What is the magnitude of the
frictional force on...
asked 8 minutes ago -
state one specific part from disability law such as ADA
(Americans with Disability Acts) or policy...
asked 9 minutes ago -
please simplify how vapor pressure lowering is related to a
rise in the boiling point solution
asked 23 minutes ago -
write a java program that does the following
Part one
Use a For loop to compute...
asked 21 minutes ago -
"A student in another class made a claim that many people are
now talking about outlawing...
asked 23 minutes ago -
Test the hypothesis using P-value approach. Be sure to verify
the requirements of the test.
H0:...
asked 1 hour ago -
For a voltaic cell based on the reaction below, which statement
is correct?
Zn(s)+2H+(aq)→Zn2+(aq)+H2(g)
Zn2+(aq) is...
asked 49 minutes ago -
If 20 g of Na2SO4 is reacted with 20 g of
Al(NO3)3 according to the following...
asked 41 minutes ago -
One difference between periodic and perpetual inventory systems
is:
Multiple Choice Cost of goods sold is...
asked 46 minutes ago -
Using the OSHA web site find the OSHA regulation for personal eye
protection. Write a summary...
asked 45 minutes ago