The following time series represents the hourly customer volume for a small dining establishment. Hour Customer...
- The following time series represents the hourly customer volume for a small dining establishment.
|
Hour |
Customer volume |
|
7:00 a.m. |
5 |
|
8:00 a.m. |
5 |
|
9:00 a.m. |
15 |
|
10:00 a.m. |
20 |
|
11:00 a.m. |
30 |
|
12:00 noon |
50 |
|
1:00 p.m. |
45 |
|
2:00 p.m. |
30 |
|
3:00 p.m. |
40 |
|
4:00 p.m. |
20 |
|
5:00 p.m. |
10 |
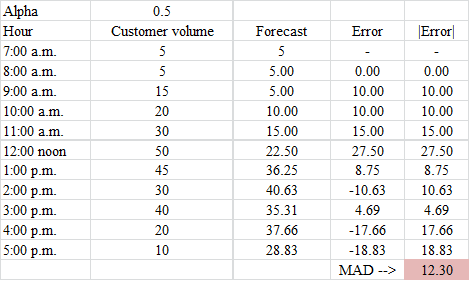
- Use an exponential smoothing model with α = 0.50 to produce forecasts for this time series. Assume that the forecast for the 7:00 a.m. time slot is 5 customers.
- What recommendations would you make regarding the use of exponential smoothing in forecasting this time series?
Homework Answers
(a)
Calculations:

Results:
(b)

As we can see from the plots, the forecast is underestimating the demand up to 1:00 pm and then from 2:00 pm onwards, it starts overestimating.
This can be improved by selecting the proper values of alpha.
For example, we can select a higher value of alpha=0.9 and observe the results:


Note that with higher values of alpha, the over- underestimating tendency reduces and the MAD also reduces. So, choose a higher value for alpha.
Add Answer to:
The following time series represents the hourly customer volume
for a small dining establishment.
Hour
Customer...
Consider the following time series data
 Consider the following time series dataa. Which of the following is a correct time series plot for this data?b. Develop the three-week moving average forecasts for this time series. Compute MSE and a forecast for week 7 (to 2 decimals if necessary) c. Use α = .2 to compute the exponential smoothing forecasts for the time series. Compute MSE and a forecast for week 7 ( 2 decimals). d. Compare the three-week moving average approach with the exponential smoothing approach using α-.2,...
Consider the following time series data. Week 1 2 3 4 5 6 Value 19 11 16 1017 15 (a) Construct a ...
 Consider the following time series data. Week 1 2 3 4 5 6 Value 19 11 16 1017 15 (a) Construct a time series plot. 20 20 20 18 16 14 12 10 c 14 12 12 0 23 4 5 67 0 23 4 5 67 Week Weck Week 20 18 0 1 2345 6 7 Week What type of pattern exists in the data? The data appear to follow a seasonal pattern. The data appear to follow a...
Consider the following time series data.
 Please help :) a. Which of the following is a correct time series plot for this data? b. Develop the three-month moving average forecasts for this time series. Compute MSE and a forecast for month 8 (to 2 decimals if necessary). c. Use α-.2 to compute the exponential smoothing forecasts for the time series. Compute MSE and a forecast for month 8 (to 2 decimals). Enter negative values as negative number. d. Compare the three-month moving average approach with the exponential smoothing approach using...
Omework Consider the following time series data Month 1 2 3 4 5 6 7 Value 21 14 18 13 18 21 14 a....
 omework Consider the following time series data Month 1 2 3 4 5 6 7 Value 21 14 18 13 18 21 14 a. Which of the following is a correct time series plot for this data? や" -Select your answer- What type of pattern exists in the data? -select your answer- b. Develop the three-month moving average forecasts for this time series. Compute MSE and a forecast for month 8 (to 2 decimals if necessary). Enter negative values as...
Homework Consider the following time series data. Week Value a. Which of the following is a...
 Homework Consider the following time series data. Week Value a. Which of the following is a correct time series plot for this data? 1 18 2 14 3 17 4 12 5 17 6 15 TimeSeries Value 115 Week TimeSeries Value 3 4 5 Week 2 TimeSeries Value 15 3 4 . 5 Week plot #1 What type of pattern exists in the data? Horizontal a Search this course mework Week plot 01 What type of pattern exists in the...
Consider the following gasoline sales time series. If needed, round your answers to two-decimal digits. Week...
Consider the following gasoline sales time series. If needed, round your answers to two-decimal digits. Week Sales (1,000s of gallons) 1 17 2 21 3 16 4 24 5 17 6 18 7 22 8 20 9 21 10 19 11 16 12 25 (a) Show the exponential smoothing forecasts using α = 0.1, and α = 0.2. Exponential Smoothing Week α = 0.1 α = 0.2 13 (b) Applying the MSE measure of forecast accuracy, would you prefer a...
Please help Consider the following time series data. Week 1 N 3 4 5 6 Value...
 Please help
Consider the following time series data. Week 1 N 3 4 5 6 Value 19 11 13 10 14 12 (a) Construct a time series plot. 20 18 20 18 14 12 10 Week 3 4 Week D 20 18+ 16 Time Series Value Time Series Value 5 Week 0 Wook What type of pattem exists in the data? The data appear to follow a cyclical pattern. The data appear to follow a trend pattem. The data appear...
Please help
Consider the following time series data. Week 1 N 3 4 5 6 Value 19 11 13 10 14 12 (a) Construct a time series plot. 20 18 20 18 14 12 10 Week 3 4 Week D 20 18+ 16 Time Series Value Time Series Value 5 Week 0 Wook What type of pattem exists in the data? The data appear to follow a cyclical pattern. The data appear to follow a trend pattem. The data appear...
Consider the following time series data Week 1 2 3 4 5 6 Value 19 14...
 Consider the following time series data Week 1 2 3 4 5 6 Value 19 14 16 12 18 15 a. Which of the following is a correct time series plot for this data? 1 Time eries Value 15 10 Week 2 TimeSeries Value 15 10 5 Week 4 3 TimeSeries Value 15 10 -5 Week 4 5 Select your answer What type of pattern exists in the data? What type of pattern exists in the data? Horizontal b. Develop...
Consider the following time series data. Week 1 2 3 4 5 6 Value 19 13 16 12 18 14 a. Whic...
Consider the following time series data. Week 1 2 3 4 5 6 Value 19 13 16 12 18 14 a. Which of the following is a correct time series plot for this data? - Select your answer -plot #1plot #2plot #3Item 1 What type of pattern exists in the data? - Select your answer -VerticalHorizontalScatterItem 2 b. Develop the three-week moving average forecasts for this time series. Compute MSE and a forecast for week (to 2 decimals if necessary)....
Consider the following time series data: Month 1 2 3 4 5 6 7 Value 24...
Consider the following time series data: Month 1 2 3 4 5 6 7 Value 24 13 21 14 20 23 15 (c) Use α = 0.2 to compute the exponential smoothing values for the time series. Compute MSE and a forecast for month 8. If required, round your answers to two decimal places. Do not round intermediate calculation. MSE: The forecast for month 8: (e) Use trial and error to find a value of the exponential smoothing coefficient α...
 Consider the following time series dataa. Which of the following is a correct time series plot for this data?b. Develop the three-week moving average forecasts for this time series. Compute MSE and a forecast for week 7 (to 2 decimals if necessary) c. Use α = .2 to compute the exponential smoothing forecasts for the time series. Compute MSE and a forecast for week 7 ( 2 decimals). d. Compare the three-week moving average approach with the exponential smoothing approach using α-.2,...
 Consider the following time series data. Week 1 2 3 4 5 6 Value 19 11 16 1017 15 (a) Construct a time series plot. 20 20 20 18 16 14 12 10 c 14 12 12 0 23 4 5 67 0 23 4 5 67 Week Weck Week 20 18 0 1 2345 6 7 Week What type of pattern exists in the data? The data appear to follow a seasonal pattern. The data appear to follow a...
 Please help :) a. Which of the following is a correct time series plot for this data? b. Develop the three-month moving average forecasts for this time series. Compute MSE and a forecast for month 8 (to 2 decimals if necessary). c. Use α-.2 to compute the exponential smoothing forecasts for the time series. Compute MSE and a forecast for month 8 (to 2 decimals). Enter negative values as negative number. d. Compare the three-month moving average approach with the exponential smoothing approach using...
 omework Consider the following time series data Month 1 2 3 4 5 6 7 Value 21 14 18 13 18 21 14 a. Which of the following is a correct time series plot for this data? や" -Select your answer- What type of pattern exists in the data? -select your answer- b. Develop the three-month moving average forecasts for this time series. Compute MSE and a forecast for month 8 (to 2 decimals if necessary). Enter negative values as...
 Homework Consider the following time series data. Week Value a. Which of the following is a correct time series plot for this data? 1 18 2 14 3 17 4 12 5 17 6 15 TimeSeries Value 115 Week TimeSeries Value 3 4 5 Week 2 TimeSeries Value 15 3 4 . 5 Week plot #1 What type of pattern exists in the data? Horizontal a Search this course mework Week plot 01 What type of pattern exists in the...
 Please help
Consider the following time series data. Week 1 N 3 4 5 6 Value 19 11 13 10 14 12 (a) Construct a time series plot. 20 18 20 18 14 12 10 Week 3 4 Week D 20 18+ 16 Time Series Value Time Series Value 5 Week 0 Wook What type of pattem exists in the data? The data appear to follow a cyclical pattern. The data appear to follow a trend pattem. The data appear...
Please help
Consider the following time series data. Week 1 N 3 4 5 6 Value 19 11 13 10 14 12 (a) Construct a time series plot. 20 18 20 18 14 12 10 Week 3 4 Week D 20 18+ 16 Time Series Value Time Series Value 5 Week 0 Wook What type of pattem exists in the data? The data appear to follow a cyclical pattern. The data appear to follow a trend pattem. The data appear...
 Consider the following time series data Week 1 2 3 4 5 6 Value 19 14 16 12 18 15 a. Which of the following is a correct time series plot for this data? 1 Time eries Value 15 10 Week 2 TimeSeries Value 15 10 5 Week 4 3 TimeSeries Value 15 10 -5 Week 4 5 Select your answer What type of pattern exists in the data? What type of pattern exists in the data? Horizontal b. Develop...
Most questions answered within 3 hours.
-
Which Model can be selected if user is involved in all phases of
sdlc.
select one...
asked 51 seconds from now -
An initial solution is made by combing 13 mL of 0.8 M
chloroacetic acid with 20...
asked 4 minutes ago -
Pellets of mass 2.0 g are fired in parallel paths with speeds of
120 m/s through...
asked 8 minutes ago -
You perform a study to investigate whether exercise influences
sleep duration. Participants record their total sleep...
asked 12 minutes ago -
The cell Cu(s)(1M) | Cu2+ || (1M) |
Cu(s) has E = 0.182 V
The cell...
asked 24 minutes ago -
i. y[n + 1] + 1.5y[n] = x[n]
ii. y[n + 1] + 0.8y[n] = x[n]...
asked 27 minutes ago -
A researcher is interested in students' opinions regarding an
additional annual fee to support non-income-producing varsity...
asked 30 minutes ago -
In about a paragraph or more, discuss why does a fund such as,
Invesco CEF Income...
asked 28 minutes ago -
A six-sided die is rolled 500 times. Use the CLT to approximate
the probability that the...
asked 31 minutes ago -
Water is poured into a container that has a leak. The mass m of
the water...
asked 37 minutes ago -
Shakespeare - whether you like his writing or not - is well
known for his writing...
asked 46 minutes ago -
A certain genetic characteristic of a particular plant can
appear in one of three forms (phenotypes)....
asked 1 hour ago