

Homework Answers

Add Answer to:
please show as much work as possible
Page |1 EG e 2019 Please show your worlearly...
An investigation of the effectiveness of a training program to improve customer relation: included a pre-training...
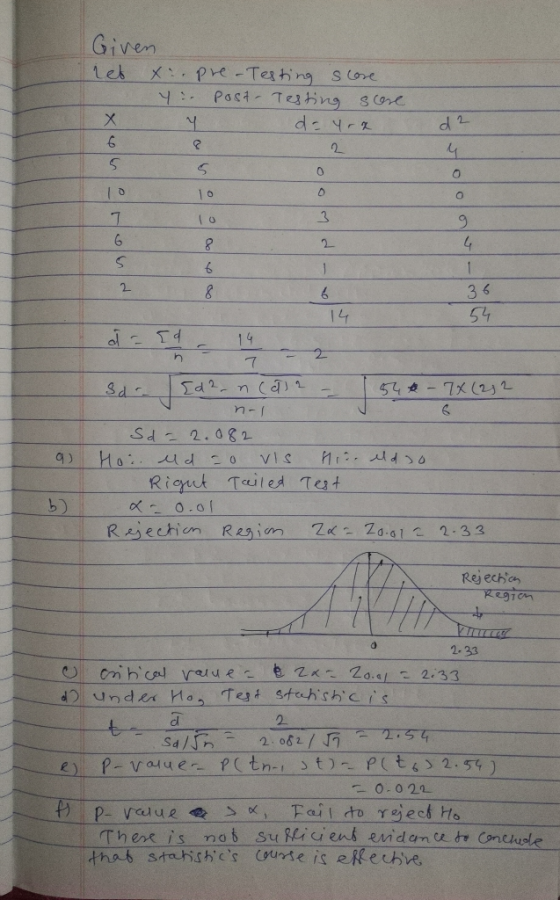
 An investigation of the effectiveness of a training program to improve customer relation: included a pre-training and post-training customer survey. To compare the differences th computed (post-training survey score - pre-training survey score). Seven customers were randomly selected and completed both surveys. The results are shown below. Customer Post-training Survey Pre-training Survey A. 5 10 10 10 8. 6. 6. 8. What is the value of the test statistic? A) 1.895 7- B) 2.542 C) 2.447 D) 1.943
a random sample of 80 graduate students 1 (6 points). A random sample of 80 graduate...
 a random sample of 80 graduate students
1 (6 points). A random sample of 80 graduate students shows that 22 students have shopped online in the past year. Is there enough evidence to show that the true population proportion is lower than 60%? Conduct the test at 10% level of significance. (a) H : type of test (circle one): H: two-sided / left tail / right tail (b) What is the distribution of the test statistic? (c) Sketch a graph...
a random sample of 80 graduate students
1 (6 points). A random sample of 80 graduate students shows that 22 students have shopped online in the past year. Is there enough evidence to show that the true population proportion is lower than 60%? Conduct the test at 10% level of significance. (a) H : type of test (circle one): H: two-sided / left tail / right tail (b) What is the distribution of the test statistic? (c) Sketch a graph...
Please show work and/or explain why this is the correct answer. A teacher wants to see...
 Please show work and/or explain why this is the correct
answer.
A teacher wants to see if a new unit on factoring is helping students learn. She has five randomly selected students take a pre-test and a post test on the material. The scores are out of 20. Has there been improvement? (pre-post) Student 1 Pre-test 12 12 Post- Test 15 1520 13 The test statistic equals -0.56. What would be the p-value? Op-value < 0.002 p-value > 0.10 p-value...
Please show work and/or explain why this is the correct
answer.
A teacher wants to see if a new unit on factoring is helping students learn. She has five randomly selected students take a pre-test and a post test on the material. The scores are out of 20. Has there been improvement? (pre-post) Student 1 Pre-test 12 12 Post- Test 15 1520 13 The test statistic equals -0.56. What would be the p-value? Op-value < 0.002 p-value > 0.10 p-value...
please provide detailed answer A teacher gives a test to her classes before and after showing...
 please provide detailed answer
A teacher gives a test to her classes before and after showing them a particular educational video. A random sample of 15 of these students is selected. It was found that 5 of these students had a higher post- video test score, 9 of them had a lower post-video test score, and 1 student had equal pre- and post-video test scores. The sign test at the 0.2 significance level will be used to test the claim...
please provide detailed answer
A teacher gives a test to her classes before and after showing them a particular educational video. A random sample of 15 of these students is selected. It was found that 5 of these students had a higher post- video test score, 9 of them had a lower post-video test score, and 1 student had equal pre- and post-video test scores. The sign test at the 0.2 significance level will be used to test the claim...
Please help, Thanks! The scores of 8 students on the midterm exam and final exam were...
 Please help, Thanks!
The scores of 8 students on the midterm exam and final exam were as follows. Student Anderson Bailey Cruz DeSana Erickson Francis Gray Harris Midterm 99 92 92 91 84 83 Final 100 82 71 80 85 72 92 88 80 75 Find the value of the (Spearman's) rank correlation coefficient test statistic that would be used to test the claim of no correlation between midterm score and final exam score. Round your answer to 3 places...
Please help, Thanks!
The scores of 8 students on the midterm exam and final exam were as follows. Student Anderson Bailey Cruz DeSana Erickson Francis Gray Harris Midterm 99 92 92 91 84 83 Final 100 82 71 80 85 72 92 88 80 75 Find the value of the (Spearman's) rank correlation coefficient test statistic that would be used to test the claim of no correlation between midterm score and final exam score. Round your answer to 3 places...
*** please explain and show me your work! im trying to understand it! 30. Suppose a...
 *** please explain and show me your work! im trying to
understand it!
30. Suppose a researcher is interested in the effectiveness of a new novel talk therapy technique in reducing overall depression as identified via score report on the geriatric depression scale (GDS). In order to carry out this hypothesis, the researcher gathers a SRS of participants in the program and performs the GDS test prior to, and after initiation of the new therapy technique. Assume the SRS score...
*** please explain and show me your work! im trying to
understand it!
30. Suppose a researcher is interested in the effectiveness of a new novel talk therapy technique in reducing overall depression as identified via score report on the geriatric depression scale (GDS). In order to carry out this hypothesis, the researcher gathers a SRS of participants in the program and performs the GDS test prior to, and after initiation of the new therapy technique. Assume the SRS score...
PLEASE SHOW IN EXCEL A professor wants to know if his lecture had an impact on...
PLEASE SHOW IN EXCEL A professor wants to know if his lecture had an impact on student learning in his class. He gives his students a pre-test at the beginning of the lecture. After he gives the lecture he gives a post-test. The post-test has similar questions in order to gauge learning. The results of the tests are: Pre-test Post-test 78 80 67 69 56 70 78 79 96 96 82 84 84 88 90 92 87 92 Did the...
E Section 3: 2 Scores/Percentiles and Hypothesis Testing Please show work. You wil need to refer ...
 e Section 3: 2 Scores/Percentiles and Hypothesis Testing Please show work. You wil need to refer to Z score tables for this rtin 6. The national (population) average for ACT scores is 208 (on a 36 point a. Suppose you score 26 on does this score fall? (Find your ACT. At approximately what percentile (round to the nearest integer between 1 and 99) your probability from the Z table, subtract that from 1, multiply by 100, and round) Answer that...
PLEASE HELP ME OUT WITH BOTH QUESTIONS!!! it is greatly appreciated!! thank you so much. no need to show the work. You w...
 PLEASE
HELP ME OUT WITH BOTH QUESTIONS!!!
it is greatly appreciated!! thank you so much. no need to show
the work.
You wish to test the claim that the average IQ score is less than 100 at the .005 significance level. You determine the hypotheses are: Ho:u= 100 H1:4 < 100 You take a simple random sample of 72 individuals and find the mean IQ score is 96.7, with a standard deviation of 15.5. Let's consider testing this hypothesis two...
PLEASE
HELP ME OUT WITH BOTH QUESTIONS!!!
it is greatly appreciated!! thank you so much. no need to show
the work.
You wish to test the claim that the average IQ score is less than 100 at the .005 significance level. You determine the hypotheses are: Ho:u= 100 H1:4 < 100 You take a simple random sample of 72 individuals and find the mean IQ score is 96.7, with a standard deviation of 15.5. Let's consider testing this hypothesis two...
PLEASE SOLVE AND SHOW IN EXCEL: A teacher would like to know if her lecture made...
PLEASE SOLVE AND SHOW IN EXCEL: A teacher would like to know if her lecture made an impact on students' learning in her class. She gives the students a pre-test before the lecture. Then after she teaches, she gives a post-test. The post-test has similar questions as the pre-test. The results are: Pre-test Post-test 78 80 67 69 56 70 78 79 96 96 82 84 84 88 90 92 87 92 The average of the post-test is (83.33) and...
 An investigation of the effectiveness of a training program to improve customer relation: included a pre-training and post-training customer survey. To compare the differences th computed (post-training survey score - pre-training survey score). Seven customers were randomly selected and completed both surveys. The results are shown below. Customer Post-training Survey Pre-training Survey A. 5 10 10 10 8. 6. 6. 8. What is the value of the test statistic? A) 1.895 7- B) 2.542 C) 2.447 D) 1.943
 a random sample of 80 graduate students
1 (6 points). A random sample of 80 graduate students shows that 22 students have shopped online in the past year. Is there enough evidence to show that the true population proportion is lower than 60%? Conduct the test at 10% level of significance. (a) H : type of test (circle one): H: two-sided / left tail / right tail (b) What is the distribution of the test statistic? (c) Sketch a graph...
a random sample of 80 graduate students
1 (6 points). A random sample of 80 graduate students shows that 22 students have shopped online in the past year. Is there enough evidence to show that the true population proportion is lower than 60%? Conduct the test at 10% level of significance. (a) H : type of test (circle one): H: two-sided / left tail / right tail (b) What is the distribution of the test statistic? (c) Sketch a graph...
 Please show work and/or explain why this is the correct
answer.
A teacher wants to see if a new unit on factoring is helping students learn. She has five randomly selected students take a pre-test and a post test on the material. The scores are out of 20. Has there been improvement? (pre-post) Student 1 Pre-test 12 12 Post- Test 15 1520 13 The test statistic equals -0.56. What would be the p-value? Op-value < 0.002 p-value > 0.10 p-value...
Please show work and/or explain why this is the correct
answer.
A teacher wants to see if a new unit on factoring is helping students learn. She has five randomly selected students take a pre-test and a post test on the material. The scores are out of 20. Has there been improvement? (pre-post) Student 1 Pre-test 12 12 Post- Test 15 1520 13 The test statistic equals -0.56. What would be the p-value? Op-value < 0.002 p-value > 0.10 p-value...
 please provide detailed answer
A teacher gives a test to her classes before and after showing them a particular educational video. A random sample of 15 of these students is selected. It was found that 5 of these students had a higher post- video test score, 9 of them had a lower post-video test score, and 1 student had equal pre- and post-video test scores. The sign test at the 0.2 significance level will be used to test the claim...
please provide detailed answer
A teacher gives a test to her classes before and after showing them a particular educational video. A random sample of 15 of these students is selected. It was found that 5 of these students had a higher post- video test score, 9 of them had a lower post-video test score, and 1 student had equal pre- and post-video test scores. The sign test at the 0.2 significance level will be used to test the claim...
 Please help, Thanks!
The scores of 8 students on the midterm exam and final exam were as follows. Student Anderson Bailey Cruz DeSana Erickson Francis Gray Harris Midterm 99 92 92 91 84 83 Final 100 82 71 80 85 72 92 88 80 75 Find the value of the (Spearman's) rank correlation coefficient test statistic that would be used to test the claim of no correlation between midterm score and final exam score. Round your answer to 3 places...
Please help, Thanks!
The scores of 8 students on the midterm exam and final exam were as follows. Student Anderson Bailey Cruz DeSana Erickson Francis Gray Harris Midterm 99 92 92 91 84 83 Final 100 82 71 80 85 72 92 88 80 75 Find the value of the (Spearman's) rank correlation coefficient test statistic that would be used to test the claim of no correlation between midterm score and final exam score. Round your answer to 3 places...
 *** please explain and show me your work! im trying to
understand it!
30. Suppose a researcher is interested in the effectiveness of a new novel talk therapy technique in reducing overall depression as identified via score report on the geriatric depression scale (GDS). In order to carry out this hypothesis, the researcher gathers a SRS of participants in the program and performs the GDS test prior to, and after initiation of the new therapy technique. Assume the SRS score...
*** please explain and show me your work! im trying to
understand it!
30. Suppose a researcher is interested in the effectiveness of a new novel talk therapy technique in reducing overall depression as identified via score report on the geriatric depression scale (GDS). In order to carry out this hypothesis, the researcher gathers a SRS of participants in the program and performs the GDS test prior to, and after initiation of the new therapy technique. Assume the SRS score...
 e Section 3: 2 Scores/Percentiles and Hypothesis Testing Please show work. You wil need to refer to Z score tables for this rtin 6. The national (population) average for ACT scores is 208 (on a 36 point a. Suppose you score 26 on does this score fall? (Find your ACT. At approximately what percentile (round to the nearest integer between 1 and 99) your probability from the Z table, subtract that from 1, multiply by 100, and round) Answer that...
 PLEASE
HELP ME OUT WITH BOTH QUESTIONS!!!
it is greatly appreciated!! thank you so much. no need to show
the work.
You wish to test the claim that the average IQ score is less than 100 at the .005 significance level. You determine the hypotheses are: Ho:u= 100 H1:4 < 100 You take a simple random sample of 72 individuals and find the mean IQ score is 96.7, with a standard deviation of 15.5. Let's consider testing this hypothesis two...
PLEASE
HELP ME OUT WITH BOTH QUESTIONS!!!
it is greatly appreciated!! thank you so much. no need to show
the work.
You wish to test the claim that the average IQ score is less than 100 at the .005 significance level. You determine the hypotheses are: Ho:u= 100 H1:4 < 100 You take a simple random sample of 72 individuals and find the mean IQ score is 96.7, with a standard deviation of 15.5. Let's consider testing this hypothesis two...
Most questions answered within 3 hours.
-
Applied manufacturing overheads are overheads allocated to the
production process according to a tariff, based on...
asked 11 seconds ago -
you are required to develop a simple HR application for a small
accounting firm that wishes...
asked 2 seconds ago -
The following present value factors are provided for use in this
problem.
Periods
Present Value
of...
asked 4 minutes ago -
In a competitive inhibition, Km is increased while Vmax is
unchanged. An enzyme is being assayed...
asked 2 minutes ago -
Celine beauty is a new cosmetics manufacturer that produces
skincare box and makeup box. Demand over...
asked 11 minutes ago -
Eleanor and Kyoko are roommates. They spend most of their time
studying (of course), but they...
asked 18 minutes ago -
Answer the questions
1.What is the value of a stock based on the dividend-growth
model if...
asked 19 minutes ago -
Per the Barron's report the average weeks unemployed is 21.5
(population mean) with a population standard...
asked 38 minutes ago -
1.. All following elements have been identified as
important to supporting school’s level of involvement with...
asked 21 minutes ago -
A hypothesis test is used to test the hypotheses H0:
μ = 10.5 versus HA: μ...
asked 48 minutes ago -
8.41- From a list of the 729 people who went on a cruise, 25
were randomly...
asked 1 hour ago -
A derrick boat approaches a two-mile marker 100 m ahead at a
velocity of 29.0 m/s....
asked 34 minutes ago