
Homework Answers

Add Answer to:
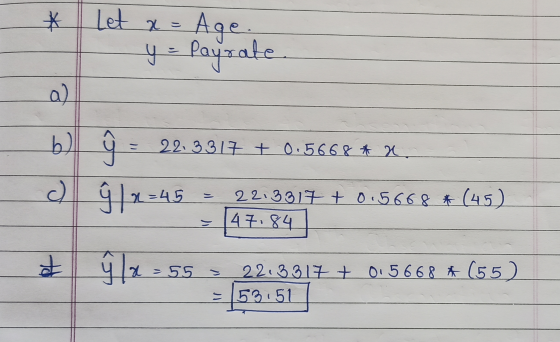
6. Complete a regression analysis using Age (x variable) to
predict Payrate (y variable).
A. Paste...
a. Using the Excel’s Regression Tool, develop the estimated regression equation to show how income (y...
a. Using the Excel’s Regression Tool, develop the estimated regression equation to show how income (y annual income in $1000s) is related to the independent variables education(level of education attained in number of years), age ( Develop the dummy variable for the gender variable first. [ 6 points] Use the t test to test whether each of the coefficients obtained in part (a) are significant at .05 level of significance. What are your conclusions? [3 points] Use the F test...
a. Use t and F to test for a significant relationship between HRS1 and age. Use...
a. Use t and F to test for a significant relationship between HRS1 and age. Use α = 0.05 and make sure you know what hypotheses you are using to conduct the significance tests.[3.5 points] b. Calculate and interpret the coefficient of determination R2. Based on this R2, did the estimated regression equation provide a good fit? Briefly justify your answer. Hint: If you used Excel Regression Tool to answer part c, R2was reported with your output. [2.5 points] Use the...
a Using the Excel’s Regression Tool, develop the estimated regression equation to show how income...
a Using the Excel’s Regression Tool, develop the estimated regression equation to show how income (y annual income in $1000s) is related to the independent variables education (level of education attained in number of years), age (Develop the dummy variable for the gender variable first. b. Use the t test to test whether each of the coefficients obtained in part (a) are significant at .05 level of significance. What are your conclusions? c. Use the F test to test...
Predict the annual income for a female aged 45 with 10 years of education. How much would the predicted income have cha...
Predict the annual income for a female aged 45 with 10 years of education. How much would the predicted income have changed for a male? [3.5 points] Plot the standardized residuals against predicted income, from regression in part (a). Check for outliers and explain whether the residual plot supports the assumptions about Ɛ. What is your conclusion? Submit the graph to earn full points. EDUCATION AGE GENDER INCOME (in $1000) 12 60 female 6.5 16 39 male 120 16 33 female...
Find the regression equation, letting the first variable be the predictor (x) variable. Using the listed...
 Find the regression equation, letting the first variable be the predictor (x) variable. Using the listed actresslactor ages in various years, find the best predicted age of the Best Actor winner given that the age of the Best Actress winner that year is 60 years. Is the result within 5 years of the actual Best Actor winner, whose age was 44 years? Best Actress 28 30 30 60 34 31 44 28 62 22 43 54 a Best Actor 42...
Statistics Participant Ethnicity Participant Age Participant Gender 90 90 90 Valid N 10 0 Missing 2.1556...
 Statistics Participant Ethnicity Participant Age Participant Gender 90 90 90 Valid N 10 0 Missing 2.1556 32.3111 1.5333 Mean 2.0000 31.5000 2.0000 Median 2.00 32.00 2.00 Mode 1.26234 11.86501 501 68 Std.Deviation 1.00 17.00 1.00 Minimum 6.00 67.00 2.00 Maximum Frequency Table Participant Gender Cumulative Percent Percent Valid Percent Frequency 42 46.7 46.7 46.7 Valid Male 48 53.3 Female 53.3 100.0 Total 90 100.0 100.0 Participant Age Cumulative Valid Percent Percent Frequency Percent 1.1 17.00 1.1 1.1 1 3.3 4.4...
The accompanying table provides data for the sex, age, and weight of bears. For sex, let...
 The accompanying table provides data for the sex, age, and weight of bears. For sex, let 0 represent female and let 1 represent male. Letting the response (y) varieble represent weight, use the dummy variable of sex and the variable of age and to find the multiple regression equation, Use the equation to find the predicted weight of a bear with the characteristics given below. Does sex appear to have much of an effect on the weight of a bear?...
The research team would like to estimate the average gender difference in age. Compute a 90%...
The research team would like to estimate the average gender difference in age. Compute a 90% estimate and confidence interval for the difference in the average age of Female and Male employees. What is the margin of error of the confidence interval ? (Use 3 decimals) Employee Number1 Annual Salary Gender Age (years) Experience (years) Training Level 1 $ 32,368 F 42 3 B 2 $ 53,174 M 54 10 B 3 $ 52,722 M 47 10 A 4 $ 53,423 M 47 1...
A hospital would like to develop a regression model to predict the total hospital bill for...
 A hospital would like to develop a regression model to predict
the total hospital bill for a patient based on the age of the
patient (x1), his or her length of stay (x2), and the number of
days in the hospital's intensive care unit(ICU) (x3). Data for
these variables can be found below. Complete parts a through e
below.
a) Construct a regression model using all three independent
variables. (Round to the nearest whole number as needed.)
b) Interpret the...
A hospital would like to develop a regression model to predict
the total hospital bill for a patient based on the age of the
patient (x1), his or her length of stay (x2), and the number of
days in the hospital's intensive care unit(ICU) (x3). Data for
these variables can be found below. Complete parts a through e
below.
a) Construct a regression model using all three independent
variables. (Round to the nearest whole number as needed.)
b) Interpret the...
the way this is worded confuses me. Will there be one problem where male weight is x and female bmi is y. or is it two problems where x&y is male weight and bmi for the 1st problem, and x&y i...
 the way this is worded confuses me. Will there be one problem
where male weight is x and female bmi is y. or is it two problems
where x&y is male weight and bmi for the 1st problem, and
x&y is female weight and bmi for problem 2?
2. Using the data set of the Health Exam Results, conduct the following of weight (WT) and Index (BMI). Number the data set from 1 to 40, and select the following individuals:...
the way this is worded confuses me. Will there be one problem
where male weight is x and female bmi is y. or is it two problems
where x&y is male weight and bmi for the 1st problem, and
x&y is female weight and bmi for problem 2?
2. Using the data set of the Health Exam Results, conduct the following of weight (WT) and Index (BMI). Number the data set from 1 to 40, and select the following individuals:...
 Find the regression equation, letting the first variable be the predictor (x) variable. Using the listed actresslactor ages in various years, find the best predicted age of the Best Actor winner given that the age of the Best Actress winner that year is 60 years. Is the result within 5 years of the actual Best Actor winner, whose age was 44 years? Best Actress 28 30 30 60 34 31 44 28 62 22 43 54 a Best Actor 42...
 Statistics Participant Ethnicity Participant Age Participant Gender 90 90 90 Valid N 10 0 Missing 2.1556 32.3111 1.5333 Mean 2.0000 31.5000 2.0000 Median 2.00 32.00 2.00 Mode 1.26234 11.86501 501 68 Std.Deviation 1.00 17.00 1.00 Minimum 6.00 67.00 2.00 Maximum Frequency Table Participant Gender Cumulative Percent Percent Valid Percent Frequency 42 46.7 46.7 46.7 Valid Male 48 53.3 Female 53.3 100.0 Total 90 100.0 100.0 Participant Age Cumulative Valid Percent Percent Frequency Percent 1.1 17.00 1.1 1.1 1 3.3 4.4...
 The accompanying table provides data for the sex, age, and weight of bears. For sex, let 0 represent female and let 1 represent male. Letting the response (y) varieble represent weight, use the dummy variable of sex and the variable of age and to find the multiple regression equation, Use the equation to find the predicted weight of a bear with the characteristics given below. Does sex appear to have much of an effect on the weight of a bear?...
 A hospital would like to develop a regression model to predict
the total hospital bill for a patient based on the age of the
patient (x1), his or her length of stay (x2), and the number of
days in the hospital's intensive care unit(ICU) (x3). Data for
these variables can be found below. Complete parts a through e
below.
a) Construct a regression model using all three independent
variables. (Round to the nearest whole number as needed.)
b) Interpret the...
A hospital would like to develop a regression model to predict
the total hospital bill for a patient based on the age of the
patient (x1), his or her length of stay (x2), and the number of
days in the hospital's intensive care unit(ICU) (x3). Data for
these variables can be found below. Complete parts a through e
below.
a) Construct a regression model using all three independent
variables. (Round to the nearest whole number as needed.)
b) Interpret the...
 the way this is worded confuses me. Will there be one problem
where male weight is x and female bmi is y. or is it two problems
where x&y is male weight and bmi for the 1st problem, and
x&y is female weight and bmi for problem 2?
2. Using the data set of the Health Exam Results, conduct the following of weight (WT) and Index (BMI). Number the data set from 1 to 40, and select the following individuals:...
the way this is worded confuses me. Will there be one problem
where male weight is x and female bmi is y. or is it two problems
where x&y is male weight and bmi for the 1st problem, and
x&y is female weight and bmi for problem 2?
2. Using the data set of the Health Exam Results, conduct the following of weight (WT) and Index (BMI). Number the data set from 1 to 40, and select the following individuals:...
Most questions answered within 3 hours.
-
Based on the range, which of the following sets of scores has
the greatest variability? 3,...
asked 36 minutes ago -
Ripples in a pond travel at a velocity of 3 m/s with one peak
passing a...
asked 26 minutes ago -
A man stands on the roof of a building of height 13.0 mm and
throws a...
asked 32 minutes ago -
The extent to which assets are financed by borrowed funds and
other liabilities is indicated by:...
asked 1 hour ago -
Explain in detail
Germany is the fifth largest economy
explain what goods and services Germany specializes...
asked 1 hour ago -
The density of platinum is 21.45 g/mL. If a cube of platinum
with a mass of...
asked 1 hour ago -
Accounts Receivable
Sales
A/R Posting
Extended Sales Invoice
Packing Slip
Compare invoice to packing slip 2...
asked 1 hour ago -
Michaella, age 23, is a full-time law student and is claimed by
her parents as a...
asked 1 hour ago -
Why are polymers not typically casted into products?
asked 2 hours ago -
When rolling a die 129 times, what is the probability of rolling
a 6 no more...
asked 2 hours ago -
4. A call option currently sells for $7.75. It has a strike
price of $85 and...
asked 2 hours ago -
1.
You need to prepare 10.0 liters of an acid aqueous solution with a
pH of...
asked 2 hours ago