The following two-way table gives data for a 2 × 2 factorial experiment with two observations per factor-level combination:

The following two-way table gives data for a 2 × 2 factorial experiment with two observations per factor-level combination: The data are saved in the LM.TXT file.
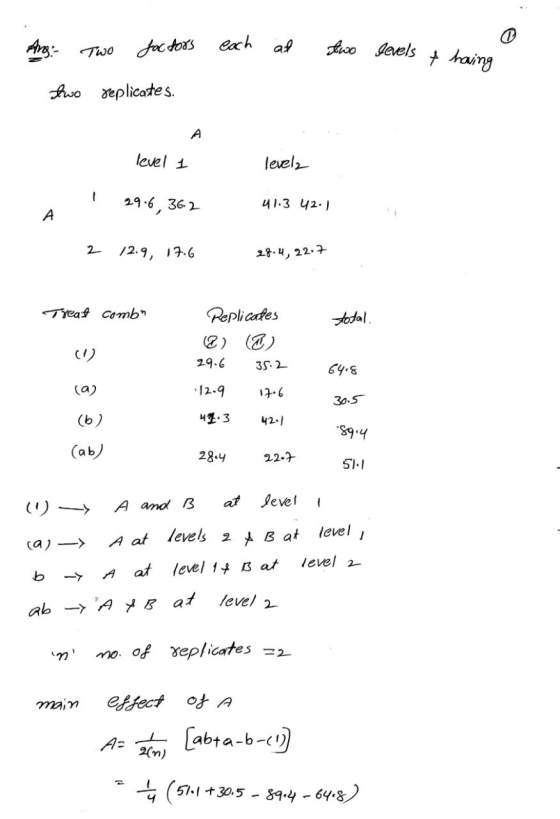
Factor B Level 1 2 Factor A 1 29.6, 35.2 47.3, 42.1 2 12.9, 17.6 28.4, 22.7
a. Identify the treatments for this experiment. Calculate and plot the treatment means, using the response variable as y-axis and the levels of factor B as the x-axis. Use the levels of factor A as plotting symbols. Do the treatment means appear to differ? Do the factors appear to interact? (3)
b. Construct an ANOVA table for this experiment. (3)
c. Test to determine whether the treatment means differ at the α=0.05 level of significant. Does the test support your visual interpretation from part a? (3)
d. Does the result of the test in part c warrant a test for interaction between the two factors? If so, perform it, using α=0.05. (3)
e. Do the results of previous tests warrant tests of the two factor mean effects? If so, perform them, using α=0.05.
LM.TXT FILE: 
> I am struggling with question a the most so if someone could please help me that would be amazing.
[email protected] Mon, May 31, 2021 9:51 PM
Homework Answers


Add Answer to:
The following two-way table gives data for a 2 × 2 factorial experiment with two observations per factor-level combination:
3. (20 points) A partially completed ANOVA table for a two-factor factorial experiment is shown here:...
 3. (20 points) A partially completed ANOVA table for a two-factor factorial experiment is shown here: Source df SS 3 1 0.95 MS F 0.75 0.30 AB Error Total 23 6.5 a Give the number of levels for each factor. b How many observations were collected for each factor-level combination? c Complete the ANOVA table above. d Test to determine whether the treatment means differ using a = 0.10?
A factorial experiment involving two levels of factor A and three levels of factor B resulted...
 A factorial experiment involving two levels of factor A and three levels of factor B resulted in the following data. Factor B Level 1 Level 2 Level 3 135 90 75 Level 1 165 93 Factor A 135 127 120 Level 2 85 105 136 Test for any significant main effects and any interaction. Use α-.05. Round Sum of Squares, F value, Mean Square to two decimals, if necessary. Source of Variation Factor A Factor B Interaction Error Total Sum...
Consider the following data for a two-factor experiment as shown to the right. Complete parts a through c Factor A Level1 Le Level 3 34 31 34 25 Level 2 34 27 21 Level 1 45 Factor B 31 27 25 19 b. Ba...
 Consider the following data for a two-factor experiment as shown to the right. Complete parts a through c Factor A Level1 Le Level 3 34 31 34 25 Level 2 34 27 21 Level 1 45 Factor B 31 27 25 19 b. Based on the sample data, can you conclude that the levels of factor A have equal means? Test using a significance eve o o.05 Choose the correct hypotheses below. HA: At least two levels of factor A...
2.- A factorial experiment with 2 replications was conducted in a laboratory to determine the eff...
 2.- A factorial experiment with 2 replications was conducted in a laboratory to determine the effects of Factor A (Time factor with 3 levels, i- 1, 2, and 3 hours) and Factor B (Temperature factor with 4 levels, j-40,40 120 and 200 degrees Fahrenheit) on the storage stability of certain chemical compound (percent degraded). The mean of the factors and the overall mean are (a) Obtain the estimators of Factor A: Answer: α.. (b) Obtain the estimators of Factor B...
17) FACTOR B Level 1 2 3 FACTOR A 1 4.1, 4.1 5.0,5.2 6.3, 6.1 8.8,9.0 2 5.8, 5.6 5.0, 5.4 Calculate the mean response f...
 17) FACTOR B Level 1 2 3 FACTOR A 1 4.1, 4.1 5.0,5.2 6.3, 6.1 8.8,9.0 2 5.8, 5.6 5.0, 5.4 Calculate the mean response for each treatment a. The MINITAB ANOVA printout is shown here. Test for interaction at the a = 0.05 b. level of significance. Analysis of variance for response SS MS df Source 0.11851 0.53777 0.53777 0.55391 5.02708 2.51334 2 1.48678 13.49334 6.74667 2 AB 27.22667 4.53778 6 Error 46.28486 11 Total Does the result warrant...
A factorial experiment involving two levels of factor A and three levels of factor B resulted...
A factorial experiment involving two levels of factor A and three levels of factor B resulted in the following data. Factor B Level 1 Level 2 Level 3 125 100 65 Level 1 155 76 103 Factor A 105 147 140 Level 2 95 125 156 Test for any significant main effects and any interaction. Use . Round Sum of Squares, value, Mean Square to two decimals, if necessary and -value to four decimals. Source of Variation Sum of Squares Degrees...
solve number 3 only 3. The following sample data stem from two-factor factorial study. a) b)...
 solve number 3 only
3. The following sample data stem from two-factor factorial study. a) b) c) Give the ANOVA model for the study. Prepare an estimated treatment means plot. Does it appear that the factors interact? Set up the ANOVA table, and carry out all appropriate tests for factor effects. In each case state the null and alternative hypotheses, the decision rule and the conclusion. Use a=.01. Factor B 1 Factor A 1 2 ,6,5 10.12.11 12,13,117.7.8 4 EEEY...
solve number 3 only
3. The following sample data stem from two-factor factorial study. a) b) c) Give the ANOVA model for the study. Prepare an estimated treatment means plot. Does it appear that the factors interact? Set up the ANOVA table, and carry out all appropriate tests for factor effects. In each case state the null and alternative hypotheses, the decision rule and the conclusion. Use a=.01. Factor B 1 Factor A 1 2 ,6,5 10.12.11 12,13,117.7.8 4 EEEY...
16. Some completely randomized design has six (6) treatments with nine (9) observations collected from cach...
 16. Some completely randomized design has six (6) treatments with nine (9) observations collected from cach treatment. Assume all pairwise comparisons of treatment means are to be made using a multiple con- parisons procedure. Determine the total number of treatment means to be compared. (a) 36 (b) 15 (c) 27 (d) 105 17. An experiment was conducted using a completely randomized block design with eight (8) treatments and five (5) blocks. Find the degrees of freedom associated with MIST and...
Consider the following partially completed two-way ANOVA table. Suppose there are four levels of Factor A...
 Consider the following partially completed two-way ANOVA table. Suppose there are four levels of Factor A and two levels of Factor B. The number of replications per cell is 4. Use the 0.01 significance level. (Hint: Estimate the values from the Ftable.) a. Complete an ANOVA table. (Round MS and Fto 2 decimal places.) ANOVA SS df MS F Source Factor A 70 3 1.40 Factor B 50 11 23.33 50.00 70.00 3.00 Interaction 210 3 4.20 Error 24 16.67...
Please round to 3 decimal places Consider the accompanying data collected for a two-way ANOVA Click...
 Please round to 3 decimal places
Consider the accompanying data collected for a two-way ANOVA Click the icon to view the data table a) Using a b) Using c) Using a 0.025, are the Factor B means different? = 0.025, is there significant interaction between Factors A and B? a = 0.025, are the Factor A means different? a) Using a 0.025, is there significant interaction between Factors A and B? Identify the hypotheses for the interaction between Factors A...
Please round to 3 decimal places
Consider the accompanying data collected for a two-way ANOVA Click the icon to view the data table a) Using a b) Using c) Using a 0.025, are the Factor B means different? = 0.025, is there significant interaction between Factors A and B? a = 0.025, are the Factor A means different? a) Using a 0.025, is there significant interaction between Factors A and B? Identify the hypotheses for the interaction between Factors A...
 3. (20 points) A partially completed ANOVA table for a two-factor factorial experiment is shown here: Source df SS 3 1 0.95 MS F 0.75 0.30 AB Error Total 23 6.5 a Give the number of levels for each factor. b How many observations were collected for each factor-level combination? c Complete the ANOVA table above. d Test to determine whether the treatment means differ using a = 0.10?
 A factorial experiment involving two levels of factor A and three levels of factor B resulted in the following data. Factor B Level 1 Level 2 Level 3 135 90 75 Level 1 165 93 Factor A 135 127 120 Level 2 85 105 136 Test for any significant main effects and any interaction. Use α-.05. Round Sum of Squares, F value, Mean Square to two decimals, if necessary. Source of Variation Factor A Factor B Interaction Error Total Sum...
 Consider the following data for a two-factor experiment as shown to the right. Complete parts a through c Factor A Level1 Le Level 3 34 31 34 25 Level 2 34 27 21 Level 1 45 Factor B 31 27 25 19 b. Based on the sample data, can you conclude that the levels of factor A have equal means? Test using a significance eve o o.05 Choose the correct hypotheses below. HA: At least two levels of factor A...
 2.- A factorial experiment with 2 replications was conducted in a laboratory to determine the effects of Factor A (Time factor with 3 levels, i- 1, 2, and 3 hours) and Factor B (Temperature factor with 4 levels, j-40,40 120 and 200 degrees Fahrenheit) on the storage stability of certain chemical compound (percent degraded). The mean of the factors and the overall mean are (a) Obtain the estimators of Factor A: Answer: α.. (b) Obtain the estimators of Factor B...
 17) FACTOR B Level 1 2 3 FACTOR A 1 4.1, 4.1 5.0,5.2 6.3, 6.1 8.8,9.0 2 5.8, 5.6 5.0, 5.4 Calculate the mean response for each treatment a. The MINITAB ANOVA printout is shown here. Test for interaction at the a = 0.05 b. level of significance. Analysis of variance for response SS MS df Source 0.11851 0.53777 0.53777 0.55391 5.02708 2.51334 2 1.48678 13.49334 6.74667 2 AB 27.22667 4.53778 6 Error 46.28486 11 Total Does the result warrant...
 solve number 3 only
3. The following sample data stem from two-factor factorial study. a) b) c) Give the ANOVA model for the study. Prepare an estimated treatment means plot. Does it appear that the factors interact? Set up the ANOVA table, and carry out all appropriate tests for factor effects. In each case state the null and alternative hypotheses, the decision rule and the conclusion. Use a=.01. Factor B 1 Factor A 1 2 ,6,5 10.12.11 12,13,117.7.8 4 EEEY...
solve number 3 only
3. The following sample data stem from two-factor factorial study. a) b) c) Give the ANOVA model for the study. Prepare an estimated treatment means plot. Does it appear that the factors interact? Set up the ANOVA table, and carry out all appropriate tests for factor effects. In each case state the null and alternative hypotheses, the decision rule and the conclusion. Use a=.01. Factor B 1 Factor A 1 2 ,6,5 10.12.11 12,13,117.7.8 4 EEEY...
 16. Some completely randomized design has six (6) treatments with nine (9) observations collected from cach treatment. Assume all pairwise comparisons of treatment means are to be made using a multiple con- parisons procedure. Determine the total number of treatment means to be compared. (a) 36 (b) 15 (c) 27 (d) 105 17. An experiment was conducted using a completely randomized block design with eight (8) treatments and five (5) blocks. Find the degrees of freedom associated with MIST and...
 Consider the following partially completed two-way ANOVA table. Suppose there are four levels of Factor A and two levels of Factor B. The number of replications per cell is 4. Use the 0.01 significance level. (Hint: Estimate the values from the Ftable.) a. Complete an ANOVA table. (Round MS and Fto 2 decimal places.) ANOVA SS df MS F Source Factor A 70 3 1.40 Factor B 50 11 23.33 50.00 70.00 3.00 Interaction 210 3 4.20 Error 24 16.67...
 Please round to 3 decimal places
Consider the accompanying data collected for a two-way ANOVA Click the icon to view the data table a) Using a b) Using c) Using a 0.025, are the Factor B means different? = 0.025, is there significant interaction between Factors A and B? a = 0.025, are the Factor A means different? a) Using a 0.025, is there significant interaction between Factors A and B? Identify the hypotheses for the interaction between Factors A...
Please round to 3 decimal places
Consider the accompanying data collected for a two-way ANOVA Click the icon to view the data table a) Using a b) Using c) Using a 0.025, are the Factor B means different? = 0.025, is there significant interaction between Factors A and B? a = 0.025, are the Factor A means different? a) Using a 0.025, is there significant interaction between Factors A and B? Identify the hypotheses for the interaction between Factors A...
Most questions answered within 3 hours.
-
What kind of materials are found in Leviticus? Give a simple
description of this book. Also...
asked 31 minutes ago -
17.1 Energy drink commercials. A study was designed to compare
Red Bull energy drink commercials. Each...
asked 34 minutes ago -
The life that maximizes net present value and shareholder wealth
is known as...
Physical Life
Economic...
asked 58 minutes ago -
You have to write your code in C++ (as a cpp file) and prepare a
docx...
asked 1 hour ago -
Why does the spectrum of bromocresol green changes at different
pHs? What causes the change?
asked 1 hour ago -
Rice Company has a unit selling price of $690, variable costs
per unit of $390, and...
asked 2 hours ago -
The DeVille Company reported pretax accounting
income on its income statement as follows:
2018
$
425,000...
asked 2 hours ago -
Argue for or against the "Three Strikes"laws. Provide a rationale
to support your response.
asked 3 hours ago -
Bargaining Models: what is the "Obsolescing Bargain"?
Bargaining Models: what are the factors that would tend...
asked 4 hours ago -
1. A ball is thrown up into the air.
a) Draw motion diagram and the point-like...
asked 4 hours ago -
1) Because money eliminates the "double coincidence of wants"
problem, the development of money as a...
asked 5 hours ago -
Company AAA produces only one product which other manufacturers
purchase as a component for their final...
asked 7 hours ago
> I need help on this too. How do I even start solving this?
[email protected] Mon, May 31, 2021 7:49 PM