

Homework Answers
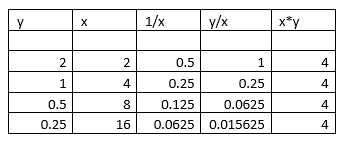

c) the graph between y and x is non linear .
d) the relationship between y and x is inverse.since the value of x increases on decreasing the value of y.
e) since the relationship is inverse ,therefore yx= k is the appropriate answer.
y=k/x
therefore yx=k
Add Answer to:
TIL. PRE-LAB QUESTIONS - Experiment 8 1. a) Complete the table below. X1/ Xy/ 2 14...
III. PRE-LAB QUESTIONS - Experiment 8 1. a) Complete the table below. y X 1/x y/x...
 III. PRE-LAB QUESTIONS - Experiment 8 1. a) Complete the table below. y X 1/x y/x x y 2 2 1/ 2 1 4 1/ 1 0. 58 TL 0.25 16 | b) On graph paper plot y vs. x (appropriately labeling all axes as well as graphing the best fitting line/curve to the data points). c) Is the relationship between the y and x data pairs linear or non-linear? d) Is the relationship between the y and x data...
c) Is the relationship direct or inverse? It will be a direct relation. 3. a) Complete...
 c) Is the relationship direct or inverse? It will be a direct relation. 3. a) Complete the table below. LE+ tast 251 0.125 0.23 0.125 0.4375 + 0.34 0.5 0.5625 y/x у 2 4 8 16 16 32 b) On graph paper plot y vs. x (appropriately labeling all axes as well as graphing the best fitting line/curve to the data points). c) Is the relationship between the y and x data pairs linear or non-linear? d) Is the relationship...
#2 between two quantities can be established. Procedure: Use the following sets of data and work...
 #2
between two quantities can be established. Procedure: Use the following sets of data and work with each one. The equation for a linear graph is y mx+b, where m is the slope and b is the y-intercept DATA SET 1: Fahrenheit-vs-Celsius Fahrenheit Celsius 32 68 104 140 176 0 20 40 60 80 1. Using Data Set 1 above, graph Fahrenheit (y)-vs- Celsius (x), using the scatterplot function in excel, or another graphing software. Make sure you label the...
#2
between two quantities can be established. Procedure: Use the following sets of data and work with each one. The equation for a linear graph is y mx+b, where m is the slope and b is the y-intercept DATA SET 1: Fahrenheit-vs-Celsius Fahrenheit Celsius 32 68 104 140 176 0 20 40 60 80 1. Using Data Set 1 above, graph Fahrenheit (y)-vs- Celsius (x), using the scatterplot function in excel, or another graphing software. Make sure you label the...
Pre-lab Questions for Experiment #8 (Experiment-20 in our lab manual) Titration of Acids and Bases 1)...
 Pre-lab Questions for Experiment #8 (Experiment-20 in our lab manual) Titration of Acids and Bases 1) Fill in the blanks in the following figure that represents the setup of today's experiment N Y (6) (1)------- - (2) ---------- (3)---------- -------------- (4)---------- 17 (8) _----- --------------- (5) --------- TO --------------- 2) What is the purpose of using phenolphthalein for an acid-base titration? 3) What is the color of phenolphthalein indicator in: a) Acidic solution: _;b) Basic solution: 4) A 40.0 mL...
A * Normal No Spacing Heading 1 Heading 2 PROCESSING THE DATA 1. According to your...
 A * Normal No Spacing Heading 1 Heading 2 PROCESSING THE DATA 1. According to your data, if the volume is doubled from 6,0 mL to 12.0 mL, what happens to the pressure? (Doubles? Triples? Halved/Reduced in half?) 2. According to your data, if the volume is halved from 14.0 mL to 7.0 mL, what happens to the pressure? (Doubles? Triples? Halved/Reduced in half?) 3. From your answers to the first two questions and the shape of the curve in...
graph 1, 2, and 3 are listed below in order for information. help with answering post lab about graph relationships. Part 1 . Prepare a graph of pressure versus temperature ( C). Be sure to f...
 graph 1, 2, and 3 are listed below in order for information.
help with answering post lab about graph relationships.
Part 1 . Prepare a graph of pressure versus temperature ( C). Be sure to follow all good graphing conventions provided in your lab manual (see Graphing Exercise). What is the relationship between gas pressure and temperature? Linear situe ayaph,showina a steady 1. rate increase. behen he 9as prešsure dnd 2. According to this experiment, what should happen to the...
graph 1, 2, and 3 are listed below in order for information.
help with answering post lab about graph relationships.
Part 1 . Prepare a graph of pressure versus temperature ( C). Be sure to follow all good graphing conventions provided in your lab manual (see Graphing Exercise). What is the relationship between gas pressure and temperature? Linear situe ayaph,showina a steady 1. rate increase. behen he 9as prešsure dnd 2. According to this experiment, what should happen to the...
please use these results of a growth curve experiment to answer the following questions Questions 1)...
 please use these results of a growth curve experiment to
answer the following questions
Questions 1) Plot the OD600 readings and cell concentration for each time point on a scatterplot with a line connecting the points. Have the measured data (OD600 and cell concentration) on the y-axis against the time on the x-axis using Excel (or other computer based data/graphing program). It is helpful to set the y-axis on a log scale for the cell concentration measurements. 2) Can you...
please use these results of a growth curve experiment to
answer the following questions
Questions 1) Plot the OD600 readings and cell concentration for each time point on a scatterplot with a line connecting the points. Have the measured data (OD600 and cell concentration) on the y-axis against the time on the x-axis using Excel (or other computer based data/graphing program). It is helpful to set the y-axis on a log scale for the cell concentration measurements. 2) Can you...
(I) Let's start with very simple data table 1.0 2.0 3.0 4.0 5.0 6.0 -1 ±...
 (I) Let's start with very simple data table 1.0 2.0 3.0 4.0 5.0 6.0 -1 ± 1.8 4±2.0 9+ 1.0 14 + 0.8 19 s 0.8 24 + 1.2 2% 1.8 34 ± 2.0 7.0 8.0 9.0 1. Plot a graph of y vs. X on a piece of graph paper 2. Is it a straight line? Draw the best-fit line. 3. Compute the slope and y-intercept for this line. Write the equation for y in terms of x using...
Am i doing this correctly? 26 o 5 10 15 Non Liner 00 OL Liner BO...
 Am i doing this correctly?
26 o 5 10 15 Non Liner 00 OL Liner BO 06 N Does this lab verify that y is directly proportional to x to x if y = x Possible answers are: yes (Y), undetermined (U), or no (N). Note that is the slope of the y vs x° graph equal to y Possible answers are: yes (Y), undetermined (U), or no (N). X X Lab-Experiment 02 Graphs Objective Verify that graphs can show...
Am i doing this correctly?
26 o 5 10 15 Non Liner 00 OL Liner BO 06 N Does this lab verify that y is directly proportional to x to x if y = x Possible answers are: yes (Y), undetermined (U), or no (N). Note that is the slope of the y vs x° graph equal to y Possible answers are: yes (Y), undetermined (U), or no (N). X X Lab-Experiment 02 Graphs Objective Verify that graphs can show...
Please help!!! Very urgent 1362 Pre-laboratory Aetivity for Coefficient of Linear Expansion Refer to: EIU Physies...
 Please help!!! Very urgent
1362 Pre-laboratory Aetivity for Coefficient of Linear Expansion Refer to: EIU Physies Department Laboratory Manual SP 2003, EIU Department of Physics and An Introduction to Error Analysis: The Study of Uncertainties in Physical Measurements 2d ed.. John R. Taylor. University Science Books, CA, 1997 Review of Least Squares Fit to a Line We often search for linear relationships between variables. In PHY 1352 the method of least squares was used as a technique to find the...
Please help!!! Very urgent
1362 Pre-laboratory Aetivity for Coefficient of Linear Expansion Refer to: EIU Physies Department Laboratory Manual SP 2003, EIU Department of Physics and An Introduction to Error Analysis: The Study of Uncertainties in Physical Measurements 2d ed.. John R. Taylor. University Science Books, CA, 1997 Review of Least Squares Fit to a Line We often search for linear relationships between variables. In PHY 1352 the method of least squares was used as a technique to find the...
 III. PRE-LAB QUESTIONS - Experiment 8 1. a) Complete the table below. y X 1/x y/x x y 2 2 1/ 2 1 4 1/ 1 0. 58 TL 0.25 16 | b) On graph paper plot y vs. x (appropriately labeling all axes as well as graphing the best fitting line/curve to the data points). c) Is the relationship between the y and x data pairs linear or non-linear? d) Is the relationship between the y and x data...
 c) Is the relationship direct or inverse? It will be a direct relation. 3. a) Complete the table below. LE+ tast 251 0.125 0.23 0.125 0.4375 + 0.34 0.5 0.5625 y/x у 2 4 8 16 16 32 b) On graph paper plot y vs. x (appropriately labeling all axes as well as graphing the best fitting line/curve to the data points). c) Is the relationship between the y and x data pairs linear or non-linear? d) Is the relationship...
 #2
between two quantities can be established. Procedure: Use the following sets of data and work with each one. The equation for a linear graph is y mx+b, where m is the slope and b is the y-intercept DATA SET 1: Fahrenheit-vs-Celsius Fahrenheit Celsius 32 68 104 140 176 0 20 40 60 80 1. Using Data Set 1 above, graph Fahrenheit (y)-vs- Celsius (x), using the scatterplot function in excel, or another graphing software. Make sure you label the...
#2
between two quantities can be established. Procedure: Use the following sets of data and work with each one. The equation for a linear graph is y mx+b, where m is the slope and b is the y-intercept DATA SET 1: Fahrenheit-vs-Celsius Fahrenheit Celsius 32 68 104 140 176 0 20 40 60 80 1. Using Data Set 1 above, graph Fahrenheit (y)-vs- Celsius (x), using the scatterplot function in excel, or another graphing software. Make sure you label the...
 Pre-lab Questions for Experiment #8 (Experiment-20 in our lab manual) Titration of Acids and Bases 1) Fill in the blanks in the following figure that represents the setup of today's experiment N Y (6) (1)------- - (2) ---------- (3)---------- -------------- (4)---------- 17 (8) _----- --------------- (5) --------- TO --------------- 2) What is the purpose of using phenolphthalein for an acid-base titration? 3) What is the color of phenolphthalein indicator in: a) Acidic solution: _;b) Basic solution: 4) A 40.0 mL...
 A * Normal No Spacing Heading 1 Heading 2 PROCESSING THE DATA 1. According to your data, if the volume is doubled from 6,0 mL to 12.0 mL, what happens to the pressure? (Doubles? Triples? Halved/Reduced in half?) 2. According to your data, if the volume is halved from 14.0 mL to 7.0 mL, what happens to the pressure? (Doubles? Triples? Halved/Reduced in half?) 3. From your answers to the first two questions and the shape of the curve in...
 graph 1, 2, and 3 are listed below in order for information.
help with answering post lab about graph relationships.
Part 1 . Prepare a graph of pressure versus temperature ( C). Be sure to follow all good graphing conventions provided in your lab manual (see Graphing Exercise). What is the relationship between gas pressure and temperature? Linear situe ayaph,showina a steady 1. rate increase. behen he 9as prešsure dnd 2. According to this experiment, what should happen to the...
graph 1, 2, and 3 are listed below in order for information.
help with answering post lab about graph relationships.
Part 1 . Prepare a graph of pressure versus temperature ( C). Be sure to follow all good graphing conventions provided in your lab manual (see Graphing Exercise). What is the relationship between gas pressure and temperature? Linear situe ayaph,showina a steady 1. rate increase. behen he 9as prešsure dnd 2. According to this experiment, what should happen to the...
 please use these results of a growth curve experiment to
answer the following questions
Questions 1) Plot the OD600 readings and cell concentration for each time point on a scatterplot with a line connecting the points. Have the measured data (OD600 and cell concentration) on the y-axis against the time on the x-axis using Excel (or other computer based data/graphing program). It is helpful to set the y-axis on a log scale for the cell concentration measurements. 2) Can you...
please use these results of a growth curve experiment to
answer the following questions
Questions 1) Plot the OD600 readings and cell concentration for each time point on a scatterplot with a line connecting the points. Have the measured data (OD600 and cell concentration) on the y-axis against the time on the x-axis using Excel (or other computer based data/graphing program). It is helpful to set the y-axis on a log scale for the cell concentration measurements. 2) Can you...
 (I) Let's start with very simple data table 1.0 2.0 3.0 4.0 5.0 6.0 -1 ± 1.8 4±2.0 9+ 1.0 14 + 0.8 19 s 0.8 24 + 1.2 2% 1.8 34 ± 2.0 7.0 8.0 9.0 1. Plot a graph of y vs. X on a piece of graph paper 2. Is it a straight line? Draw the best-fit line. 3. Compute the slope and y-intercept for this line. Write the equation for y in terms of x using...
 Am i doing this correctly?
26 o 5 10 15 Non Liner 00 OL Liner BO 06 N Does this lab verify that y is directly proportional to x to x if y = x Possible answers are: yes (Y), undetermined (U), or no (N). Note that is the slope of the y vs x° graph equal to y Possible answers are: yes (Y), undetermined (U), or no (N). X X Lab-Experiment 02 Graphs Objective Verify that graphs can show...
Am i doing this correctly?
26 o 5 10 15 Non Liner 00 OL Liner BO 06 N Does this lab verify that y is directly proportional to x to x if y = x Possible answers are: yes (Y), undetermined (U), or no (N). Note that is the slope of the y vs x° graph equal to y Possible answers are: yes (Y), undetermined (U), or no (N). X X Lab-Experiment 02 Graphs Objective Verify that graphs can show...
 Please help!!! Very urgent
1362 Pre-laboratory Aetivity for Coefficient of Linear Expansion Refer to: EIU Physies Department Laboratory Manual SP 2003, EIU Department of Physics and An Introduction to Error Analysis: The Study of Uncertainties in Physical Measurements 2d ed.. John R. Taylor. University Science Books, CA, 1997 Review of Least Squares Fit to a Line We often search for linear relationships between variables. In PHY 1352 the method of least squares was used as a technique to find the...
Please help!!! Very urgent
1362 Pre-laboratory Aetivity for Coefficient of Linear Expansion Refer to: EIU Physies Department Laboratory Manual SP 2003, EIU Department of Physics and An Introduction to Error Analysis: The Study of Uncertainties in Physical Measurements 2d ed.. John R. Taylor. University Science Books, CA, 1997 Review of Least Squares Fit to a Line We often search for linear relationships between variables. In PHY 1352 the method of least squares was used as a technique to find the...
Most questions answered within 3 hours.
-
A gas occupies 200. mL in a piston. If the pressure of the
piston were decreased...
asked 15 minutes ago -
A fossil is found to have a 14C level of 71.0% compared to
living organisms. How...
asked 18 minutes ago -
Many communist or socialist countries have a department that
addresses public health as well as the...
asked 20 minutes ago -
the following questions are either true or false answers
1. The Central Limit Theorem allows one...
asked 21 minutes ago -
The patient recovery time from a particular surgical procedure
is normally distributed with a mean of...
asked 27 minutes ago -
Human relations refer to the way a company arranges people,
jobs, and communications so that work...
asked 44 minutes ago -
Python Program: Design the logic for and implement a program
that merges the two files into...
asked 42 minutes ago -
The specific radiocarbon activity of a sample of wood is 6.25
gms dpm/gm of carbon. The...
asked 47 minutes ago -
An aqueous magnesium chloride solution is made by dissolving
6.96 moles of MgCl2 in sufficient water...
asked 50 minutes ago -
Ken believes the average age of men who come to get a haircut at
his barber...
asked 1 hour ago -
(Ratio Analysis): Last year Co. XYZ had sales of $ 400,000, with
“cost of goods sold”...
asked 1 hour ago -
can someone please write the balanced chemical
equation for the synthesis of Bromoacetanilide
from;
aniline +...
asked 1 hour ago