Age Survivorship Fecundity 0 1000 0 1 990 0 2 970 0 3 940 1 4...
|
Age |
Survivorship |
Fecundity |
|
0 |
1000 |
0 |
|
1 |
990 |
0 |
|
2 |
970 |
0 |
|
3 |
940 |
1 |
|
4 |
900 |
2 |
|
5 |
850 |
3 |
|
6 |
10 |
5 |
What kind of survivorship curve does this population have?
3. Use the data from the table to predict how this population will be doing after 6 years. Note you will have to calculate the % survival to use for cohorts beyond the first cohort.
Homework Answers
A survivorship curve shows the relationship of number of individuals surviving at different age groups of a species.
If we plot the values given the table we get a curve as follows:
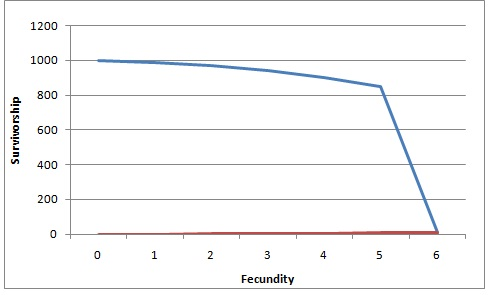
(*X-axis shows age not fecundity)
This is type 1 survivorship curve, characterized by hige age-specific survival probability in early and mid age, followed by a rapid decline in the later years.
Question: What type of survivorship curve does it have? Questions 1-6 are based on the following...
 Question: What type of survivorship curve does it have?
Questions 1-6 are based on the following calculation of population trajectory. Managers are producing another new breeding colony of snuffles with the following age-specific survival rates (sx) and reproduction rates (mx). Calculate the population trajectory and the age distribution of this population for twelve years using the table below. mx SX mx age age specific fecundity age specific survivorship SX 1-2 10.5 3-4 20.5 5-6 30.5 7-8 2 0.5 9- 100...
Question: What type of survivorship curve does it have?
Questions 1-6 are based on the following calculation of population trajectory. Managers are producing another new breeding colony of snuffles with the following age-specific survival rates (sx) and reproduction rates (mx). Calculate the population trajectory and the age distribution of this population for twelve years using the table below. mx SX mx age age specific fecundity age specific survivorship SX 1-2 10.5 3-4 20.5 5-6 30.5 7-8 2 0.5 9- 100...
Question 2 1.5 pts Use the cohort life table to answer the question. Age Class Survivorship...
 Question 2 1.5 pts Use the cohort life table to answer the question. Age Class Survivorship Mortality Fecundity 0-1 0.50 1-2 0.4 2-3 0.33 3-4 0.5 4.2 4-5 5-6 0.0 Assume the initial population was 1000 individuals and the ratio between males and females was 50/50. Which of the following is TRUE? SELECT ALL THAT APPLY. The age class 4-5 produced 150 offspring. Individuals in age class 2-3 were more likely to die than individuals in age class 3-4. Individuals...
Table 4. 1975 cohort of G. conden x 5. To visualize survivorship in a graph, it...
 Table 4. 1975 cohort of G. conden x 5. To visualize survivorship in a graph, it is often helpful to calculate the log of survivorship so that the graphed data are more reasonably scaled. Complete Table 4 to the right to log-transform the survivorship data for the 1975 cohort of G. scandens (round to the hundredths place). 0 Nx 82 42 1 2 3 4. Use your values from Table 4 and the grid below to create a survivorship curve...
Ecology questions for final exam (Practice). Just the answers for now are fine but will ask...
 Ecology questions for final exam (Practice). Just the answers
for now are fine but will ask questions depending on the answer.
THANK YOU. Covid-19 has made learning difficult.
16. Competition has a negative effect on the individual's fitness via its negative effect on survival, growth, fecundity a. True b. False 90-94 Age 25-29 Questions 17 - 21 are based on the graph to the right. This graph describes the age structure of a population 100+ 95-99 17. The fraction of...
Ecology questions for final exam (Practice). Just the answers
for now are fine but will ask questions depending on the answer.
THANK YOU. Covid-19 has made learning difficult.
16. Competition has a negative effect on the individual's fitness via its negative effect on survival, growth, fecundity a. True b. False 90-94 Age 25-29 Questions 17 - 21 are based on the graph to the right. This graph describes the age structure of a population 100+ 95-99 17. The fraction of...
You have become concerned about the practice of setting up feeding stations for feral cats. You...
 You have become concerned about the practice of setting up feeding stations for feral cats. You really like cats, out research links large populations of feral cats to high mortality of songbirds, small reptiles and amphibian, as Teral cats often utilize these as a food source Community advocates for the feeding stations insist that the cal populations are stable and not a problem. You find a researcher who has been collecting data on populations of teral cats (often called community...
1. Newborns and Infants: 0-1 year of age 2. Toddlers:1-3 years of age 3. Preschoolers: 3-6...
 1. Newborns and Infants: 0-1 year of age
2. Toddlers:1-3 years of age
3. Preschoolers: 3-6 years of age
4. School-Age Children: 6-12 years of age
5. Adolescents to Young Adults: 12-21 years of age
Partial Question 14 0.08 / 0.5 pts Match the developmental process with the age range a therapist could typically expect to observe such a characteristic. *You may use an answer more than once. Limited understanding of separation and an increasing awareness of cause and effect....
1. Newborns and Infants: 0-1 year of age
2. Toddlers:1-3 years of age
3. Preschoolers: 3-6 years of age
4. School-Age Children: 6-12 years of age
5. Adolescents to Young Adults: 12-21 years of age
Partial Question 14 0.08 / 0.5 pts Match the developmental process with the age range a therapist could typically expect to observe such a characteristic. *You may use an answer more than once. Limited understanding of separation and an increasing awareness of cause and effect....
City code %drivers21 fatal accidents/1000 1 12 1.309 2 5 0 3 12 2.539 4 9 2...
 city code
%drivers21
fatal accidents/1000
1
12
1.309
2
5
0
3
12
2.539
4
9
2.003
5
11
2.034
6
14
4.08
7
13
2.639
8
9
0.124
9
6
0
10
10
1.145
11
13
2.719
12
18
3.128
13
10
1.676
14
17
3.769
15
14
2.639
16
13
1.449
17
12
3.121
18
10
2.616
19
9
0.788
20
14
2.631
21
10
1.887
22
12
1
23
9
0.652
24
12
1.209
25
15
0.775...
city code
%drivers21
fatal accidents/1000
1
12
1.309
2
5
0
3
12
2.539
4
9
2.003
5
11
2.034
6
14
4.08
7
13
2.639
8
9
0.124
9
6
0
10
10
1.145
11
13
2.719
12
18
3.128
13
10
1.676
14
17
3.769
15
14
2.639
16
13
1.449
17
12
3.121
18
10
2.616
19
9
0.788
20
14
2.631
21
10
1.887
22
12
1
23
9
0.652
24
12
1.209
25
15
0.775...
Who can help me to solve the questions 1-4? Figure 4-5 is the same as Figure 4-6 Exercise B4&5 A 1-3 C6-12 F 19 & 20 E 16-18 D 13-15 Chromosome Formula: 44 + XXY Sex of Patient: Male Name of...
 Who can help me to solve the questions 1-4?
Figure 4-5 is the same as Figure 4-6
Exercise B4&5 A 1-3 C6-12 F 19 & 20 E 16-18 D 13-15 Chromosome Formula: 44 + XXY Sex of Patient: Male Name of Syndrome, if any: Klenifelter's Syndrome Description of Syndrome, if any: Y G 21 & 22 sorry--you'll have to look this up yourself! Sample human karyotype. Use as a guide for assembling your karyotype on Figure 4-6. Figure 4-5. Lab...
Who can help me to solve the questions 1-4?
Figure 4-5 is the same as Figure 4-6
Exercise B4&5 A 1-3 C6-12 F 19 & 20 E 16-18 D 13-15 Chromosome Formula: 44 + XXY Sex of Patient: Male Name of Syndrome, if any: Klenifelter's Syndrome Description of Syndrome, if any: Y G 21 & 22 sorry--you'll have to look this up yourself! Sample human karyotype. Use as a guide for assembling your karyotype on Figure 4-6. Figure 4-5. Lab...
>|10|1|00001100-10110100 )13-175576 3 3 5 3 4 5 53 548532762 332244445 35931-12 10-4-0 5 2 2 1 7 ...
 please answer this question subject about Business Statistics
thanks
>|10|1|00001100-10110100 )13-175576 3 3 5 3 4 5 53 548532762 332244445 35931-12 10-4-0 5 2 2 1 7 4 6 4 4 6 5 9 4 4 9 5 6 794 453991567557258 04693|44838468346011 |00 | 3 7 6 4 5 7 5 0 1 5 7 3 6 5 3 6 34 a 1001110011011000-1 10-01-0101| 0 0 10 2880724703 3524354534 09| 8 3 9 6 5 7 7 3 2093151508 43355343343444343532...
please answer this question subject about Business Statistics
thanks
>|10|1|00001100-10110100 )13-175576 3 3 5 3 4 5 53 548532762 332244445 35931-12 10-4-0 5 2 2 1 7 4 6 4 4 6 5 9 4 4 9 5 6 794 453991567557258 04693|44838468346011 |00 | 3 7 6 4 5 7 5 0 1 5 7 3 6 5 3 6 34 a 1001110011011000-1 10-01-0101| 0 0 10 2880724703 3524354534 09| 8 3 9 6 5 7 7 3 2093151508 43355343343444343532...
0 X 1.TX T 1 .III .2. 3 .III.4. III .5. III .6. II . ,...
 0 X 1.TX T 1 .III .2. 3 .III.4. III .5. III .6. II . , 7 . i. Resistors for electronic circuits are manufactured on a high-speed automated machine. The machine is set up to produce a large run of resistors of 1,000 ohms each. Use Exhibit 10.13 To set up the machine and to create a control chart to be used throughout the run, 15 samples were taken with four resistors in each sample. The complete list of...
 Question: What type of survivorship curve does it have?
Questions 1-6 are based on the following calculation of population trajectory. Managers are producing another new breeding colony of snuffles with the following age-specific survival rates (sx) and reproduction rates (mx). Calculate the population trajectory and the age distribution of this population for twelve years using the table below. mx SX mx age age specific fecundity age specific survivorship SX 1-2 10.5 3-4 20.5 5-6 30.5 7-8 2 0.5 9- 100...
Question: What type of survivorship curve does it have?
Questions 1-6 are based on the following calculation of population trajectory. Managers are producing another new breeding colony of snuffles with the following age-specific survival rates (sx) and reproduction rates (mx). Calculate the population trajectory and the age distribution of this population for twelve years using the table below. mx SX mx age age specific fecundity age specific survivorship SX 1-2 10.5 3-4 20.5 5-6 30.5 7-8 2 0.5 9- 100...
 Question 2 1.5 pts Use the cohort life table to answer the question. Age Class Survivorship Mortality Fecundity 0-1 0.50 1-2 0.4 2-3 0.33 3-4 0.5 4.2 4-5 5-6 0.0 Assume the initial population was 1000 individuals and the ratio between males and females was 50/50. Which of the following is TRUE? SELECT ALL THAT APPLY. The age class 4-5 produced 150 offspring. Individuals in age class 2-3 were more likely to die than individuals in age class 3-4. Individuals...
 Table 4. 1975 cohort of G. conden x 5. To visualize survivorship in a graph, it is often helpful to calculate the log of survivorship so that the graphed data are more reasonably scaled. Complete Table 4 to the right to log-transform the survivorship data for the 1975 cohort of G. scandens (round to the hundredths place). 0 Nx 82 42 1 2 3 4. Use your values from Table 4 and the grid below to create a survivorship curve...
 Ecology questions for final exam (Practice). Just the answers
for now are fine but will ask questions depending on the answer.
THANK YOU. Covid-19 has made learning difficult.
16. Competition has a negative effect on the individual's fitness via its negative effect on survival, growth, fecundity a. True b. False 90-94 Age 25-29 Questions 17 - 21 are based on the graph to the right. This graph describes the age structure of a population 100+ 95-99 17. The fraction of...
Ecology questions for final exam (Practice). Just the answers
for now are fine but will ask questions depending on the answer.
THANK YOU. Covid-19 has made learning difficult.
16. Competition has a negative effect on the individual's fitness via its negative effect on survival, growth, fecundity a. True b. False 90-94 Age 25-29 Questions 17 - 21 are based on the graph to the right. This graph describes the age structure of a population 100+ 95-99 17. The fraction of...
 You have become concerned about the practice of setting up feeding stations for feral cats. You really like cats, out research links large populations of feral cats to high mortality of songbirds, small reptiles and amphibian, as Teral cats often utilize these as a food source Community advocates for the feeding stations insist that the cal populations are stable and not a problem. You find a researcher who has been collecting data on populations of teral cats (often called community...
 1. Newborns and Infants: 0-1 year of age
2. Toddlers:1-3 years of age
3. Preschoolers: 3-6 years of age
4. School-Age Children: 6-12 years of age
5. Adolescents to Young Adults: 12-21 years of age
Partial Question 14 0.08 / 0.5 pts Match the developmental process with the age range a therapist could typically expect to observe such a characteristic. *You may use an answer more than once. Limited understanding of separation and an increasing awareness of cause and effect....
1. Newborns and Infants: 0-1 year of age
2. Toddlers:1-3 years of age
3. Preschoolers: 3-6 years of age
4. School-Age Children: 6-12 years of age
5. Adolescents to Young Adults: 12-21 years of age
Partial Question 14 0.08 / 0.5 pts Match the developmental process with the age range a therapist could typically expect to observe such a characteristic. *You may use an answer more than once. Limited understanding of separation and an increasing awareness of cause and effect....
 city code
%drivers21
fatal accidents/1000
1
12
1.309
2
5
0
3
12
2.539
4
9
2.003
5
11
2.034
6
14
4.08
7
13
2.639
8
9
0.124
9
6
0
10
10
1.145
11
13
2.719
12
18
3.128
13
10
1.676
14
17
3.769
15
14
2.639
16
13
1.449
17
12
3.121
18
10
2.616
19
9
0.788
20
14
2.631
21
10
1.887
22
12
1
23
9
0.652
24
12
1.209
25
15
0.775...
city code
%drivers21
fatal accidents/1000
1
12
1.309
2
5
0
3
12
2.539
4
9
2.003
5
11
2.034
6
14
4.08
7
13
2.639
8
9
0.124
9
6
0
10
10
1.145
11
13
2.719
12
18
3.128
13
10
1.676
14
17
3.769
15
14
2.639
16
13
1.449
17
12
3.121
18
10
2.616
19
9
0.788
20
14
2.631
21
10
1.887
22
12
1
23
9
0.652
24
12
1.209
25
15
0.775...
 Who can help me to solve the questions 1-4?
Figure 4-5 is the same as Figure 4-6
Exercise B4&5 A 1-3 C6-12 F 19 & 20 E 16-18 D 13-15 Chromosome Formula: 44 + XXY Sex of Patient: Male Name of Syndrome, if any: Klenifelter's Syndrome Description of Syndrome, if any: Y G 21 & 22 sorry--you'll have to look this up yourself! Sample human karyotype. Use as a guide for assembling your karyotype on Figure 4-6. Figure 4-5. Lab...
Who can help me to solve the questions 1-4?
Figure 4-5 is the same as Figure 4-6
Exercise B4&5 A 1-3 C6-12 F 19 & 20 E 16-18 D 13-15 Chromosome Formula: 44 + XXY Sex of Patient: Male Name of Syndrome, if any: Klenifelter's Syndrome Description of Syndrome, if any: Y G 21 & 22 sorry--you'll have to look this up yourself! Sample human karyotype. Use as a guide for assembling your karyotype on Figure 4-6. Figure 4-5. Lab...
 please answer this question subject about Business Statistics
thanks
>|10|1|00001100-10110100 )13-175576 3 3 5 3 4 5 53 548532762 332244445 35931-12 10-4-0 5 2 2 1 7 4 6 4 4 6 5 9 4 4 9 5 6 794 453991567557258 04693|44838468346011 |00 | 3 7 6 4 5 7 5 0 1 5 7 3 6 5 3 6 34 a 1001110011011000-1 10-01-0101| 0 0 10 2880724703 3524354534 09| 8 3 9 6 5 7 7 3 2093151508 43355343343444343532...
please answer this question subject about Business Statistics
thanks
>|10|1|00001100-10110100 )13-175576 3 3 5 3 4 5 53 548532762 332244445 35931-12 10-4-0 5 2 2 1 7 4 6 4 4 6 5 9 4 4 9 5 6 794 453991567557258 04693|44838468346011 |00 | 3 7 6 4 5 7 5 0 1 5 7 3 6 5 3 6 34 a 1001110011011000-1 10-01-0101| 0 0 10 2880724703 3524354534 09| 8 3 9 6 5 7 7 3 2093151508 43355343343444343532...
 0 X 1.TX T 1 .III .2. 3 .III.4. III .5. III .6. II . , 7 . i. Resistors for electronic circuits are manufactured on a high-speed automated machine. The machine is set up to produce a large run of resistors of 1,000 ohms each. Use Exhibit 10.13 To set up the machine and to create a control chart to be used throughout the run, 15 samples were taken with four resistors in each sample. The complete list of...
Most questions answered within 3 hours.
-
Dopamine Hydrochloride: draw the structure And Show the
functional groups in different colors and label the...
asked 51 seconds ago -
A rope supports a 10 kg dumbbell hanging from it. What is the
tension in the...
asked 22 seconds ago -
Suppose that you know that in the population of full-time
employees in the United States, the...
asked 8 minutes ago -
This experiment was designed originally to sample various meat and carcass quality
aspects of Ontario pigs...
asked 8 minutes ago -
) Raw materials are studied for contamination. Suppose that
the number of particles of contamination per...
asked 22 minutes ago -
After running a regression analysis we calculated an F test and
the significance level was 0.15....
asked 18 minutes ago -
----Can someone please help me solve this one using JAVA
----I thank you in advance
Create...
asked 23 minutes ago -
1. What force primarily attracts the potassium ion to
the nitrate ion?
a. London forces...
asked 24 minutes ago -
What are the negative effects of abruptly stopping the use of
all fossil fuels? Give at...
asked 31 minutes ago -
Given that many conflict are the result of different parties having
different interests, is it possible...
asked 36 minutes ago -
A 750 g block can slide uniformly along the horizontal track
when a string attached to...
asked 39 minutes ago -
In 2017, Juan entered into a contract to write a book. The
publisher advanced Juan $50,000,...
asked 53 minutes ago