
| city code | %drivers21 | fatal accidents/1000 |
| 1 | 12 | 1.309 |
| 2 | 5 | 0 |
| 3 | 12 | 2.539 |
| 4 | 9 | 2.003 |
| 5 | 11 | 2.034 |
| 6 | 14 | 4.08 |
| 7 | 13 | 2.639 |
| 8 | 9 | 0.124 |
| 9 | 6 | 0 |
| 10 | 10 | 1.145 |
| 11 | 13 | 2.719 |
| 12 | 18 | 3.128 |
| 13 | 10 | 1.676 |
| 14 | 17 | 3.769 |
| 15 | 14 | 2.639 |
| 16 | 13 | 1.449 |
| 17 | 12 | 3.121 |
| 18 | 10 | 2.616 |
| 19 | 9 | 0.788 |
| 20 | 14 | 2.631 |
| 21 | 10 | 1.887 |
| 22 | 12 | 1 |
| 23 | 9 | 0.652 |
| 24 | 12 | 1.209 |
| 25 | 15 | 0.775 |
| 26 | 9 | 0.23 |
| 27 | 20 | 4.814 |
| 28 | 9 | 1.172 |
| 29 | 11 | 1.015 |
| 30 | 16 | 3.333 |
| 31 | 16 | 2.607 |
| 32 | 14 | 2.154 |
** I HAVE POSTED THIS QUESTION A SECOND TIME FOR 13,14 and 15, because this question is too long for 1 answer! ** Please Answer 9,10,11, and 12 as they are simply related. 13, 14, 15 can be done in the next question!***
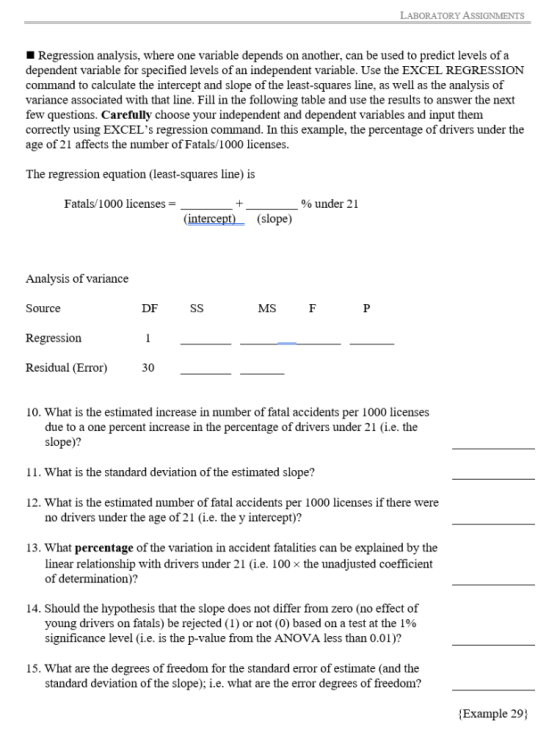
LABORATORY ASSIGNMENTS Regression analysis, where one variable depends on another, can be used to predict levels of a dependent variable for specified levels of an independent variable. Use the EXCEL REGRESSION command to calculate the intercept and slope of the least-squares line, as well as the analysis of variance associated with that line. Fill in the following table and use the results to answer the next few questions. Carefully choose your independent and dependent variables and input them correctly using EXCEL's regression command. In this example, the percentage of drivers under the age of 21 affects the number of Fatals/1000 licenses. The regression equation (least-squares line) is Fatals/1000 licenses- 90 under 21 (intercept) (slope) Analysis of variance Source DF MS Regression Residual (Error) 30 10. What is the estimated increase in number of fatal accidents per 1000 licenses due to a one percent increase in the percentage of drivers under 21 (i.e. the slope)? I l. what is the standard deviation of the estimated slope? 12. What is the estimated number of fatal accidents per 1000 licenses if there were no drivers under the age of 21 (i.e. the y intercept)? 13. What percentage of the variation in accident fatalities can be explained by the linear relationship with drivers under 21 (i.e. 100 × the unadjusted coefficient of determination)? 14. Should the hypothesis that the slope does not differ from zero (no effect of young drivers on fatals) be rejected (1) or not (0) based on a test at the 1% significance level (i.e. is the p-value from the ANOVA less than 0.01)? 15. What are the degrees of freedom for the standard error of estimate (and the standard deviation of the slope); i.e. what are the error degrees of freedom? Example 29
Homework Answers
9)
City 27 had the highest number of fatal accidents per 1000 licensed driver.
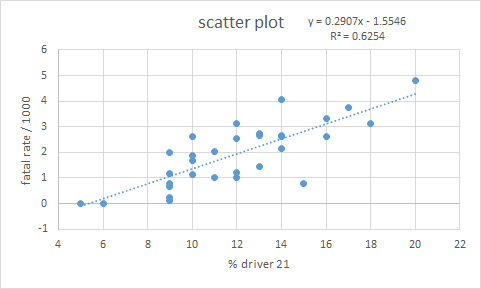
there is a significant increase number fatalities with increase % driver 21
fatals/1000licensed = -1.5742 + 0.2907 % under 21
| Source |
DF |
Sum of Squares | Mean Square | F Statistic | P-value |
|---|---|---|---|---|---|
| Regression (between ŷi andyibar) |
1 |
28.9021 |
28.9021 |
49.0189 |
8.838e-8 |
| Residual (between yi and ŷi) |
30 |
17.6884 |
0.5896 |
||
| Total(between yi andyibar) |
31 |
46.5905 |
1.5029 |
10) increase fatal accidents 0.2907/1000 licenses due to one percent increase of the % under 214
11) square root of [( residual)/ (n-2)]
= square root of [(17.6884)/(32-2)]
= 0.76786
12) fatals/1000licensed = -1.5742 + 0.2907 % under 21
fatals/1000licensed = -1.5742 + 0.2907 * 0
so, fatals/1000licensed = -1.5742
13) R square (R2) equals 0.6203. It means 62.03 % variation of fatalities explained by % under 21.
14) Ho: slope = 0
Ha: slope 
t stat = slope / SE
|
Coeff |
SE | t-stat | lower t0.025(30) | upper t0.975(30) |
Stand Coeff |
p-value |
VIF |
|
|---|---|---|---|---|---|---|---|---|
| intercept | -1.5742 | 0.5164 | -3.0483 | -2.6288 | -0.5195 | 0.000 | 0.004772 | |
| slope | 0.2907 | 0.04152 | 7.0014 | 0.2059 | 0.3755 | 0.7876 | 8.838e-8 | 1.0000 |
t stat = 7.0014 and p value is 8.838e-8 means % under 21 has a significant effect on fatalitis because p value < 0.01.
15) n-2 = 32-2 = 30
Add Answer to:
City code %drivers21 fatal accidents/1000 1 12 1.309 2 5 0 3 12 2.539 4 9 2...
26) A study in transportation safety collected data on 42 North American cities. From each city,...
 26) A study in transportation safety collected data on 42 North American cities. From each city, two of the variables recorded were X = percentage of licensed drivers who are under 21 years of age, and Y = the number of fatal accidents per year per 1000 licenses. Below is the output from the data: Parameter Intercept Std. Estimate -1.59741 Error 0.371671 T Statistic -4.29792 p-value 0.0001 0.0293898 9.76711 0.0000 Slope 0.287053 Correlation coefficient = 0.839387 R-squared = 70.4571 percent...
The following data is a regression model where the U.S. Department of Transportation has tried to...
 The following data is a regression model where the U.S. Department of Transportation has tried to relate the rate of fatal traffic accidents (per 1000 licenses) to the percentage of motorists under the age of 21. Data has been collected for 42 major cities in the United States. SUMMARY OUTPUT Regression Statistics Multiple R R Square Adjusted R Square Standard Error Observations 0.83938748 0.70457134 0.69718562 0.58935028 42 ANOVA df MS Regression Residual Total 33.13441764 33.1344 95.3964 13.89335048 0.34733 47.02776812 40...
Assigned Media Question Help The data in the table represent the number of licensed drivers in...
 Assigned Media Question Help The data in the table represent the number of licensed drivers in various age groups and the number of fatal accidents within the age group by gender. Complete parts (a) through (c) below. :: Click the icon to view the data table. (a) Find the least-squares regression line for males treating the number of licensed drivers as the explanatory variable, x, and the number of fatal crashes, y, as the response variable. Repeat this procedure for...
Time Period t Daily Sales 1 59 2 56 3 92 4 78 5 63 6...
Time Period t Daily Sales 1 59 2 56 3 92 4 78 5 63 6 75 7 81 8 65 9 99 10 86 11 72 12 89 13 107 14 104 15 93 16 106 17 104 18 124 19 110 20 106 Given the Data Above for the first 20 days Daily Sales of a new restaurant, use a Regression Tool like DATA ANALYSIS in Excel and find each of the following: Slope of Regression Equation =...
2. Calculate the velocity at each time (except the first and the last one) by using values immedi...
 2. Calculate the velocity at each time (except the first and the last one) by using values immediately after and before those times: the tn-- For example, the velocity at point 2 is n Time t (s) Position x (m) Velocity v (m/s) vt (unit-mls) aGou .245 8 3,abus 1.553 3. calculate v/t (what are the units?) and write it in column 5 of the table above. Calculate its average and its uncertainty: Average uncertainty: 4. On the graph paper,...
Questions 6, 7, 10, 11 and 12. Question 6 1 pts Select the appropriate equation for...
 Questions 6, 7, 10, 11 and 12.
Question 6 1 pts Select the appropriate equation for the line of prediction from the SPSS output. Coefficients Standardized Coefficients Beta Sig. Unstandardized Coefficients Model B Std. Error 1 (Constant) 3.977 1.193 Variable 1 414 096 Variable 2 -2019 2011 a. Dependent Variable: Outcome (Y) 458 -181 t 3.333 4.313 -1.704 .001 000 ,093 O Yhat = 3.977 +4.313X1 - 1703X2 Yhat - 3.977 +0.458X, -0.181X2 Yhat = 3.333+4.313X1 - 1703X, Yhat =...
Questions 6, 7, 10, 11 and 12.
Question 6 1 pts Select the appropriate equation for the line of prediction from the SPSS output. Coefficients Standardized Coefficients Beta Sig. Unstandardized Coefficients Model B Std. Error 1 (Constant) 3.977 1.193 Variable 1 414 096 Variable 2 -2019 2011 a. Dependent Variable: Outcome (Y) 458 -181 t 3.333 4.313 -1.704 .001 000 ,093 O Yhat = 3.977 +4.313X1 - 1703X2 Yhat - 3.977 +0.458X, -0.181X2 Yhat = 3.333+4.313X1 - 1703X, Yhat =...
no. of absences, x 0 1 2 3 4 5 6 7 8 9 Final exam...
no. of absences, x 0 1 2 3 4 5 6 7 8 9 Final exam score, y 88.3 85.5 82.8 81.2 78.3 73.4 64.4 70.9 64.7 66.4 n 3 .997 4 .950 5 .878 6 .811 7 .754 8 .707 9 .666 10 .632 11 .602 12 .576 13 .553 14 .532 15 .514 16 .497 17 .482 18 .468 19 .456 20 .444 21 .433 22 .423 23 .413 24 .404 25 .396 26 .388 27 .381 28...
>|10|1|00001100-10110100 )13-175576 3 3 5 3 4 5 53 548532762 332244445 35931-12 10-4-0 5 2 2 1 7 ...
 please answer this question subject about Business Statistics
thanks
>|10|1|00001100-10110100 )13-175576 3 3 5 3 4 5 53 548532762 332244445 35931-12 10-4-0 5 2 2 1 7 4 6 4 4 6 5 9 4 4 9 5 6 794 453991567557258 04693|44838468346011 |00 | 3 7 6 4 5 7 5 0 1 5 7 3 6 5 3 6 34 a 1001110011011000-1 10-01-0101| 0 0 10 2880724703 3524354534 09| 8 3 9 6 5 7 7 3 2093151508 43355343343444343532...
please answer this question subject about Business Statistics
thanks
>|10|1|00001100-10110100 )13-175576 3 3 5 3 4 5 53 548532762 332244445 35931-12 10-4-0 5 2 2 1 7 4 6 4 4 6 5 9 4 4 9 5 6 794 453991567557258 04693|44838468346011 |00 | 3 7 6 4 5 7 5 0 1 5 7 3 6 5 3 6 34 a 1001110011011000-1 10-01-0101| 0 0 10 2880724703 3524354534 09| 8 3 9 6 5 7 7 3 2093151508 43355343343444343532...
from part 5-12 plz dont do 1-4 BUNUS Assignment! A Sample Data AnalySIS III Licer Please...
 from part 5-12 plz dont do 1-4
BUNUS Assignment! A Sample Data AnalySIS III Licer Please answer all of the following questions. Make sure you show all your work, providing snapshots from Excel as well as listing all formulas and relevant explanation, as needed. We are interested in exploring the relationship between the income of professors (measured in thousands of dollars) and the number of years they have been employed by the university. We collect the following data from eight...
from part 5-12 plz dont do 1-4
BUNUS Assignment! A Sample Data AnalySIS III Licer Please answer all of the following questions. Make sure you show all your work, providing snapshots from Excel as well as listing all formulas and relevant explanation, as needed. We are interested in exploring the relationship between the income of professors (measured in thousands of dollars) and the number of years they have been employed by the university. We collect the following data from eight...
.2 6 9 3 8 3 2 1 5 5 4 9 9 9 4 5 7 5 4 7 82445538955922245 5 3 4 3 2 5 3 2 4 3 2 2 4 3 2 3 2 2 2 ...
 ***(unable to provide data except by using
pictures)
.2 6 9 3 8 3 2 1 5 5 4 9 9 9 4 5 7 5 4 7 82445538955922245 5 3 4 3 2 5 3 2 4 3 2 2 4 3 2 3 2 2 2 1 2 2 4 2 2 2 1 3 3 3 12 233 7 8 2 8 3 1 12111 2-21 1 382015785685 7 599231958 0 2 2 5 782 2990957503 1...
***(unable to provide data except by using
pictures)
.2 6 9 3 8 3 2 1 5 5 4 9 9 9 4 5 7 5 4 7 82445538955922245 5 3 4 3 2 5 3 2 4 3 2 2 4 3 2 3 2 2 2 1 2 2 4 2 2 2 1 3 3 3 12 233 7 8 2 8 3 1 12111 2-21 1 382015785685 7 599231958 0 2 2 5 782 2990957503 1...
 26) A study in transportation safety collected data on 42 North American cities. From each city, two of the variables recorded were X = percentage of licensed drivers who are under 21 years of age, and Y = the number of fatal accidents per year per 1000 licenses. Below is the output from the data: Parameter Intercept Std. Estimate -1.59741 Error 0.371671 T Statistic -4.29792 p-value 0.0001 0.0293898 9.76711 0.0000 Slope 0.287053 Correlation coefficient = 0.839387 R-squared = 70.4571 percent...
 The following data is a regression model where the U.S. Department of Transportation has tried to relate the rate of fatal traffic accidents (per 1000 licenses) to the percentage of motorists under the age of 21. Data has been collected for 42 major cities in the United States. SUMMARY OUTPUT Regression Statistics Multiple R R Square Adjusted R Square Standard Error Observations 0.83938748 0.70457134 0.69718562 0.58935028 42 ANOVA df MS Regression Residual Total 33.13441764 33.1344 95.3964 13.89335048 0.34733 47.02776812 40...
 Assigned Media Question Help The data in the table represent the number of licensed drivers in various age groups and the number of fatal accidents within the age group by gender. Complete parts (a) through (c) below. :: Click the icon to view the data table. (a) Find the least-squares regression line for males treating the number of licensed drivers as the explanatory variable, x, and the number of fatal crashes, y, as the response variable. Repeat this procedure for...
 2. Calculate the velocity at each time (except the first and the last one) by using values immediately after and before those times: the tn-- For example, the velocity at point 2 is n Time t (s) Position x (m) Velocity v (m/s) vt (unit-mls) aGou .245 8 3,abus 1.553 3. calculate v/t (what are the units?) and write it in column 5 of the table above. Calculate its average and its uncertainty: Average uncertainty: 4. On the graph paper,...
 Questions 6, 7, 10, 11 and 12.
Question 6 1 pts Select the appropriate equation for the line of prediction from the SPSS output. Coefficients Standardized Coefficients Beta Sig. Unstandardized Coefficients Model B Std. Error 1 (Constant) 3.977 1.193 Variable 1 414 096 Variable 2 -2019 2011 a. Dependent Variable: Outcome (Y) 458 -181 t 3.333 4.313 -1.704 .001 000 ,093 O Yhat = 3.977 +4.313X1 - 1703X2 Yhat - 3.977 +0.458X, -0.181X2 Yhat = 3.333+4.313X1 - 1703X, Yhat =...
Questions 6, 7, 10, 11 and 12.
Question 6 1 pts Select the appropriate equation for the line of prediction from the SPSS output. Coefficients Standardized Coefficients Beta Sig. Unstandardized Coefficients Model B Std. Error 1 (Constant) 3.977 1.193 Variable 1 414 096 Variable 2 -2019 2011 a. Dependent Variable: Outcome (Y) 458 -181 t 3.333 4.313 -1.704 .001 000 ,093 O Yhat = 3.977 +4.313X1 - 1703X2 Yhat - 3.977 +0.458X, -0.181X2 Yhat = 3.333+4.313X1 - 1703X, Yhat =...
 please answer this question subject about Business Statistics
thanks
>|10|1|00001100-10110100 )13-175576 3 3 5 3 4 5 53 548532762 332244445 35931-12 10-4-0 5 2 2 1 7 4 6 4 4 6 5 9 4 4 9 5 6 794 453991567557258 04693|44838468346011 |00 | 3 7 6 4 5 7 5 0 1 5 7 3 6 5 3 6 34 a 1001110011011000-1 10-01-0101| 0 0 10 2880724703 3524354534 09| 8 3 9 6 5 7 7 3 2093151508 43355343343444343532...
please answer this question subject about Business Statistics
thanks
>|10|1|00001100-10110100 )13-175576 3 3 5 3 4 5 53 548532762 332244445 35931-12 10-4-0 5 2 2 1 7 4 6 4 4 6 5 9 4 4 9 5 6 794 453991567557258 04693|44838468346011 |00 | 3 7 6 4 5 7 5 0 1 5 7 3 6 5 3 6 34 a 1001110011011000-1 10-01-0101| 0 0 10 2880724703 3524354534 09| 8 3 9 6 5 7 7 3 2093151508 43355343343444343532...
 from part 5-12 plz dont do 1-4
BUNUS Assignment! A Sample Data AnalySIS III Licer Please answer all of the following questions. Make sure you show all your work, providing snapshots from Excel as well as listing all formulas and relevant explanation, as needed. We are interested in exploring the relationship between the income of professors (measured in thousands of dollars) and the number of years they have been employed by the university. We collect the following data from eight...
from part 5-12 plz dont do 1-4
BUNUS Assignment! A Sample Data AnalySIS III Licer Please answer all of the following questions. Make sure you show all your work, providing snapshots from Excel as well as listing all formulas and relevant explanation, as needed. We are interested in exploring the relationship between the income of professors (measured in thousands of dollars) and the number of years they have been employed by the university. We collect the following data from eight...
 ***(unable to provide data except by using
pictures)
.2 6 9 3 8 3 2 1 5 5 4 9 9 9 4 5 7 5 4 7 82445538955922245 5 3 4 3 2 5 3 2 4 3 2 2 4 3 2 3 2 2 2 1 2 2 4 2 2 2 1 3 3 3 12 233 7 8 2 8 3 1 12111 2-21 1 382015785685 7 599231958 0 2 2 5 782 2990957503 1...
***(unable to provide data except by using
pictures)
.2 6 9 3 8 3 2 1 5 5 4 9 9 9 4 5 7 5 4 7 82445538955922245 5 3 4 3 2 5 3 2 4 3 2 2 4 3 2 3 2 2 2 1 2 2 4 2 2 2 1 3 3 3 12 233 7 8 2 8 3 1 12111 2-21 1 382015785685 7 599231958 0 2 2 5 782 2990957503 1...
Most questions answered within 3 hours.
-
What would you expect the observed boiling point to be at 10
torrs of a liquid...
asked 1 minute ago -
write a javascript jquery code to display calendar and let it be
sticked on the textbox...
asked 9 minutes ago -
A Call Spread is
A.
The simultaneous purchase of a call and
sale of a put...
asked 8 minutes ago -
In response to concerns about a future recession, the government
decides to give consumers a tax...
asked 10 minutes ago -
Experimental studies of cancer often use strains of animals that
have a naturally high incidence of...
asked 15 minutes ago -
Sociology Question Emile Durkheim
What role does mass media play in the lives of contemporary
citizens?...
asked 20 minutes ago -
Why would you silence gene expression for both wild-type and
mutants? I am on a question...
asked 29 minutes ago -
While all of the elements below are helpful, Booth et al. (2008)
emphasize that it is...
asked 34 minutes ago -
2. Use the three-step method to analyze the effects of the event
on the equilibrium price...
asked 34 minutes ago -
Draw a Venn diagram of three domains of life and explain.
asked 38 minutes ago -
In testing a new drug, researchers found that 5% of all patients
using it will have...
asked 1 hour ago -
List the six general types of information management systems,
and give one logistics application to each...
asked 57 minutes ago