
Homework Answers
a) Sample mean = 
x = midpoint
f= frequency
b) 
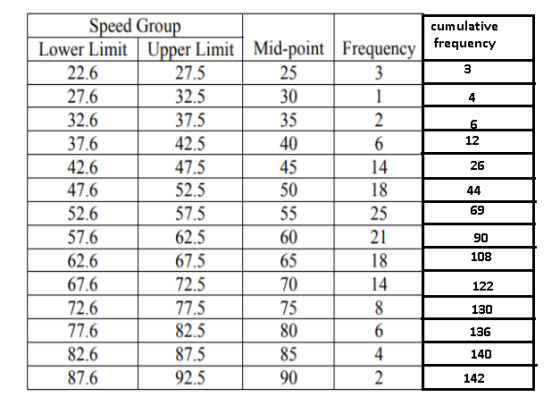
 is the
median group
is the
median group


c)
 is the
modal group
is the
modal group

d) ![S^2=\frac{1}{n-1}[\sum fX^2-\frac{(\sum fX)^2}{n}]=\frac{1}{142-1}[512550-\frac{(8267)^2}{142}]=221.70](http://img.homeworklib.com/questions/778fbfa0-00aa-11ec-90e5-6556c2ff3db7.png?x-oss-process=image/resize,w_560)
Add Answer to:
1. Consider the following sample spot speed data. The speeds are in miles per hour Speed...
4. (12 pts) The speed limit on a highway is 70 miles per hour. A sample...
 4. (12 pts) The speed limit on a highway is 70 miles per hour. A sample of 8 cars are clocked at 69 mph, with a sample standard deviation of 5 miles per hour. Can we say, with at least 90 percent confidence that the average speed on the road is above 65? tcale = tarit Can we be at least 90 percent confidence that the average speed >70?
2. Data was collected from a highway with a 65 mph speed limit. A speed “gun”...
2. Data was collected from a highway with a 65 mph speed limit. A speed “gun” sampled 12 random vehicles and found the mean to be 60.67 mph with a standard deviation of 4.08 mph. i. Which model would be used to construct a confidence interval for the mean 2i) speed of all vehicles on that highway? a) students-t b) least squares linear regression c) Binomial d) Normal ii. The standard deviation for this sampling distribution would be calculated using,...
Indy 500 Qualifier Speeds The speeds in miles per hour of six randomly selected qualifiers for...
 Indy 500 Qualifier Speeds The speeds in miles per hour of six randomly selected qualifiers for the Indianapolis 500 (in 2012) are listed below. Estimate the mean qualifying speed with 90% confidence. Assume the variable is normally distributed. Use a graphing calculator and round the answers to at least two decimal places. 222.929 226.240 225.172 222.891 226.484 223.684 Send data te Excel Thunderstorm Speeds A meteorologist who sampled 5 thunderstorms found that the average speed at which they traveled across...
Do drivers follow the posted speed limit of 65 mph on Interstate 270? The following data...
Do drivers follow the posted speed limit of 65 mph on Interstate 270? The following data give the speeds (mph), as measured by radar, of 10 randomly selected cars traveling on Interstate 270: 76 72 80 68 76 74 71 78 82 64 Assume all conditions are met for confidence intervals. Find a 99% confidence interval for the population mean speed of all drivers on I-270. [3] Find a 95% confidence interval for the population mean speed of...
(5 points) The Highway Safety Department wants to study the driving habits of individuals. A sample...
(5 points) The Highway Safety Department wants to study the driving habits of individuals. A sample of 38 cars traveling on a particular stretch of highway revealed an average speed of 68.9 miles per hour with a standard deviation of 5.9 miles per hour. Round to 4 decimal places. 1.Calculate a 99% confidence interval for the true mean speed of all cars on this particular stretch of highway. ( , ) 2. Based on the confidence interval do you think...
(3 points) The Highway Safety Department wants to study the driving habits of individuals. A sample...
 (3 points) The Highway Safety Department wants to study the driving habits of individuals. A sample of 43 cars traveling on a particular stretch of highway revealed an average speed of 67.7 miles per hour with a standard deviation of 7.2 miles per hour. Round to 4 decimal places. 1.Calculate a 90% confidence interval for the true mean speed of all cars on this particular stretch of highway. 2. What sample size is needed to estimate the true average speed...
The average annual wind speed in Rochester, Minnesota is 15.5 miles per hour. If a sample...
The average annual wind speed in Rochester, Minnesota is 15.5 miles per hour. If a sample of 95 days are used to determine the average wind speed, find the 98% confidence interval of the mean. Assume the standard deviation was 3.2 miles per hour. (Show Work)
A sheriff cracks down on speeders. Following the crackdown, the sheriff takes a random sample (n...
A sheriff cracks down on speeders. Following the crackdown, the sheriff takes a random sample (n = 100) of vehicle speeds on the roadway. The sample data: sample mean, 47 mph; sample standard deviation, 8 mph. (i) Using the sample standard deviation as a substitute for the population standard deviation, what is the standard error of the sample mean? (ii) Using the ±2 shortcut, what is the 95 percent confidence interval of the sample mean? 2. A skeptical county commissioner...
(3 points) The Highway Safety Department wants to study the driving habits of individuals. A sample...
 (3 points) The Highway Safety Department wants to study the driving habits of individuals. A sample of 43 cars traveling on a particular stretch of highway revealed an average speed of 67.7 miles per hour with a standard deviation of 10 miles per hour. Round to 4 decimal places. 1. Calculate a 90% confidence interval for the true mean speed of all cars on this particular stretch of highway. (65.135 , 70.265 ) 2. What sample size is needed to...
At wind speeds above 1000 centimeters per second (cm/sec), significant sand-moving events begin to occur. Wind...
At wind speeds above 1000 centimeters per second (cm/sec), significant sand-moving events begin to occur. Wind speeds below 1000 cm/sec deposit sand and wind speeds above 1000 cm/sec move sand to new locations. The cyclic nature of wind and moving sand determines the shape and location of large dunes. At a test site, the prevailing direction of the wind did not change noticeably. However, the velocity did change. Sixty-three wind speed readings gave an average velocity of x = 1075...
 4. (12 pts) The speed limit on a highway is 70 miles per hour. A sample of 8 cars are clocked at 69 mph, with a sample standard deviation of 5 miles per hour. Can we say, with at least 90 percent confidence that the average speed on the road is above 65? tcale = tarit Can we be at least 90 percent confidence that the average speed >70?
 Indy 500 Qualifier Speeds The speeds in miles per hour of six randomly selected qualifiers for the Indianapolis 500 (in 2012) are listed below. Estimate the mean qualifying speed with 90% confidence. Assume the variable is normally distributed. Use a graphing calculator and round the answers to at least two decimal places. 222.929 226.240 225.172 222.891 226.484 223.684 Send data te Excel Thunderstorm Speeds A meteorologist who sampled 5 thunderstorms found that the average speed at which they traveled across...
 (3 points) The Highway Safety Department wants to study the driving habits of individuals. A sample of 43 cars traveling on a particular stretch of highway revealed an average speed of 67.7 miles per hour with a standard deviation of 7.2 miles per hour. Round to 4 decimal places. 1.Calculate a 90% confidence interval for the true mean speed of all cars on this particular stretch of highway. 2. What sample size is needed to estimate the true average speed...
 (3 points) The Highway Safety Department wants to study the driving habits of individuals. A sample of 43 cars traveling on a particular stretch of highway revealed an average speed of 67.7 miles per hour with a standard deviation of 10 miles per hour. Round to 4 decimal places. 1. Calculate a 90% confidence interval for the true mean speed of all cars on this particular stretch of highway. (65.135 , 70.265 ) 2. What sample size is needed to...
Most questions answered within 3 hours.
-
Explain why case-mix analysis should be performed by
health care facilities. List other types of analysis...
asked 1 hour ago -
1.
Today Tomorrow
Price of Coke 1.90 2.10
Quantity of Pepsi 297 303
a. Write down...
asked 2 hours ago -
Fluorine-20 has a half-life of 11.0 s. If a sample initially
contains 36.0 μg of this...
asked 2 hours ago -
How many fissions take place per second in a 190-MW reactor?
Assume 200 MeV is released...
asked 4 hours ago -
IQ scores are normally distributed with a mean of 100 and a
standard deviation of 15....
asked 4 hours ago -
You are to assess the biomechanics of a male’s arm using his
bicep to hold a...
asked 6 hours ago -
What is the maximum number of grams of N-acetyl-p-toluidine can
be prepared from 70. milliliters of...
asked 7 hours ago -
A researcher is using a two-tailed hypothesis test with α =
.05 to evaluate the effect...
asked 9 hours ago -
Two long, straight wires are parallel and 8.5 cm apart. The top
wire carries a current...
asked 10 hours ago -
Three arguments used to promote trade barriers are the national
security argument, the infant-industry argument, and...
asked 10 hours ago -
Question 3:
Percentage of Completion
Method (12 marks) On January 1, 2017, Eagle Construction Ltd.
started...
asked 10 hours ago -
A company purchased a tract of land for its natural resources at
a cost of $2,042,900....
asked 10 hours ago