
Homework Answers
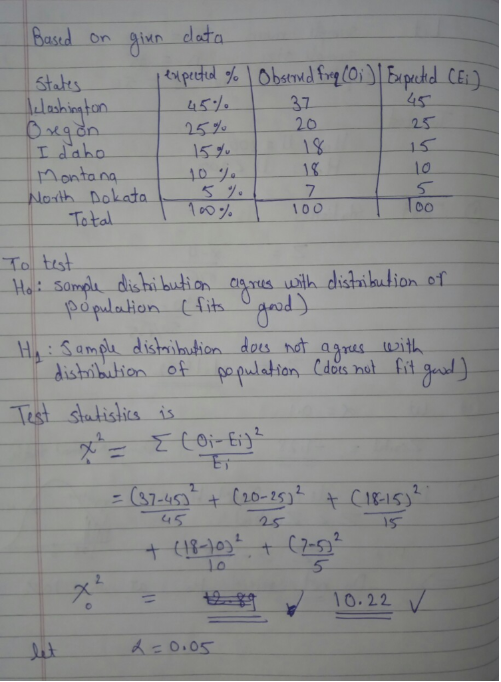
Based on the given data
| States | Expected % | Observed Freq (Oi) | Expected ( Ei ) |
| Washington | 45% | 37 | 45 |
| Oregon | 25% | 20 | 25 |
| Idaho | 15% | 18 | 15 |
| Montana | 10% | 18 | 10 |
| MNorth Dokata | 5% | 7 | 5 |
| Total | 100% | 100 | 100 |
To test
Ho : Sample distribution agrees with distribution of population ( fits good )
H1 : Sample distribution does not agrees with distribution of population ( does not fit good )
Decision rule is rejest Ho id P - value
Hence P - value < 0.05
=> Reject Ho at alpha = 0.05
Conclusion : ->
There is not sufficent evidence to support claim sample subjects has distribution that agreea with distribution of population at alpha = 0.05.

Add Answer to:
4
2. Chi-Square goodness-of-fit test Arn ong the five northwestern states, Washington has 45% of the...
Goodness of Fit Test Perform the Goodness-of-Fit Test 1) Perform the indicated goodness-of-fit test. A company...
 Goodness of Fit Test Perform the Goodness-of-Fit Test 1) Perform the indicated goodness-of-fit test. A company manager wishes to test a union leader's claim that absences occur on the different week days with the same frequencies. Test this claim at the 0.05 level of significance if the following sample data have been compiled. Day Mon Tue Wed Thurs Fri Absences 37 15 12 23 43 Step 1: Ho: H Step 2: Significance level is Step 3: Test Statistics Step 4:...
-A chi-square test for goodness-of-fit has a sample size of 50. What are the degrees of...
-A chi-square test for goodness-of-fit has a sample size of 50. What are the degrees of freedom for this chi square? A. 25 B. The degrees of freedom cannot be determined from the information provided. C. 50 D. 49 -Rodney wants to test the relationship between college graduation rank and annual income. If income is measured on a ratio scale, the appropriate relationship test for Rodney to use is the: A. chi square test of independence B. independent-samples t test...
When we carry out a chi-square goodness-of-fit test for a normal distribution, the null hypothesis states...
When we carry out a chi-square goodness-of-fit test for a normal distribution, the null hypothesis states that the population: a) does not have a normal distribution. b) has a normal distribution. c) has a chi-square distribution. d) does not have a chi-square distribution. e) has k − 3 degrees of freedom.
In performing a chi-square goodness-of-fit test for a normal distribution, a researcher wants to make sure...
In performing a chi-square goodness-of-fit test for a normal distribution, a researcher wants to make sure that all of the expected cell frequencies are at least five. The sample is divided into 7 intervals. The second through the sixth intervals all have expected cell frequencies of at least five. The first and the last intervals have expected cell frequencies of 1.5 each. After adjusting the number of intervals, the degrees of freedom for the chi-square statistic is ____. 2, 3,5,...
The test statistic for goodness of fit has a chi-square distribution with k - 1 degrees...
The test statistic for goodness of fit has a chi-square distribution with k - 1 degrees of freedom provided that the expected frequencies for all categories are a. 10 or more. b. k or more. c. 2k. d. 5 or more.
In performing a chi-square goodness-of-fit test for a normal distribution, a researcher wants to make sure...
 In performing a chi-square goodness-of-fit test for a normal distribution, a researcher wants to make sure that all of the expected cell frequencies are at least five. The sample is divided into 7 intervals. The second through the sixth intervals all have expected cell frequencies of at least five. The first and the last intervals have expected cell frequencies of 1.5 each. After adjusting the number of intervals, the degrees of freedom for the chi-square statistic is O 2 3...
3. The chi-square test for goodness of fit- No preference Aa Aa A developmental psychologist is...
 3. The chi-square test for goodness of fit- No preference Aa Aa A developmental psychologist is studying bonding between healthy newborn bables and immediate family members. He wants to know if mothers use smell to recognize their one-week-old infants. To investigate, he selects a randonm sample of mothers of one-week-old infants. Each mother is presented with a garment worn by her infant and two garments wom by unrelated babies. He asks each of the mothers to identify her infant's garment....
Part III. Goodness of Fit test. (15 pts) This question is exercise 15 from your textbook's...
 Part III. Goodness of Fit test. (15 pts) This question is exercise 15 from your textbook's chapter 13. Assume that a researcher wants to be sure that the sample in her study is not unrepresentative of the distribution of ethnic groups in her community. Her sample includes 300 whites, 80 african americans, 100 hispanics, 40 asians, and 80 "others". Ethnicity thus comprises a 5 category nominal dependent variable. In her community, according to census records, the population has 48% whites,...
5. The chi-square test for goodness of fit - No difference from a known population Aa...
 5. The chi-square test for goodness of fit - No difference from a known population Aa Aa Suppose you are reading a study conducted in the year 2000 about welfare recipients in the United States. The authors report the following frequency data on the household size of the 2,352 welfare recipients in their random sample: Observed Frequencies Household Size 5-or-more-person 4-person 3-person 2-person 1-person 282 753 588 400 329 You wonder if welfare recipients tend to live in different-sized households...
Please attempt at problem dealing in Chi-Square (Goodness of Fit). Thank you 006Chapter 22 Exercise employment has acualy increased in the past 3 years, or whether the change in empleymens can be...
 Please attempt at problem dealing in Chi-Square (Goodness of Fit).
Thank you
006Chapter 22 Exercise employment has acualy increased in the past 3 years, or whether the change in empleymens can be explained by random puecruations: What is a Type I error in this case? Whar is a Tipe Il error? 22.8.10 Imagine you are performing a statistical test to determine i Exercise 22.8.1 Sappose someone is trying to sell you a coin that favors heads. You snwch a cotm,...
Please attempt at problem dealing in Chi-Square (Goodness of Fit).
Thank you
006Chapter 22 Exercise employment has acualy increased in the past 3 years, or whether the change in empleymens can be explained by random puecruations: What is a Type I error in this case? Whar is a Tipe Il error? 22.8.10 Imagine you are performing a statistical test to determine i Exercise 22.8.1 Sappose someone is trying to sell you a coin that favors heads. You snwch a cotm,...
 Goodness of Fit Test Perform the Goodness-of-Fit Test 1) Perform the indicated goodness-of-fit test. A company manager wishes to test a union leader's claim that absences occur on the different week days with the same frequencies. Test this claim at the 0.05 level of significance if the following sample data have been compiled. Day Mon Tue Wed Thurs Fri Absences 37 15 12 23 43 Step 1: Ho: H Step 2: Significance level is Step 3: Test Statistics Step 4:...
 In performing a chi-square goodness-of-fit test for a normal distribution, a researcher wants to make sure that all of the expected cell frequencies are at least five. The sample is divided into 7 intervals. The second through the sixth intervals all have expected cell frequencies of at least five. The first and the last intervals have expected cell frequencies of 1.5 each. After adjusting the number of intervals, the degrees of freedom for the chi-square statistic is O 2 3...
 3. The chi-square test for goodness of fit- No preference Aa Aa A developmental psychologist is studying bonding between healthy newborn bables and immediate family members. He wants to know if mothers use smell to recognize their one-week-old infants. To investigate, he selects a randonm sample of mothers of one-week-old infants. Each mother is presented with a garment worn by her infant and two garments wom by unrelated babies. He asks each of the mothers to identify her infant's garment....
 Part III. Goodness of Fit test. (15 pts) This question is exercise 15 from your textbook's chapter 13. Assume that a researcher wants to be sure that the sample in her study is not unrepresentative of the distribution of ethnic groups in her community. Her sample includes 300 whites, 80 african americans, 100 hispanics, 40 asians, and 80 "others". Ethnicity thus comprises a 5 category nominal dependent variable. In her community, according to census records, the population has 48% whites,...
 5. The chi-square test for goodness of fit - No difference from a known population Aa Aa Suppose you are reading a study conducted in the year 2000 about welfare recipients in the United States. The authors report the following frequency data on the household size of the 2,352 welfare recipients in their random sample: Observed Frequencies Household Size 5-or-more-person 4-person 3-person 2-person 1-person 282 753 588 400 329 You wonder if welfare recipients tend to live in different-sized households...
 Please attempt at problem dealing in Chi-Square (Goodness of Fit).
Thank you
006Chapter 22 Exercise employment has acualy increased in the past 3 years, or whether the change in empleymens can be explained by random puecruations: What is a Type I error in this case? Whar is a Tipe Il error? 22.8.10 Imagine you are performing a statistical test to determine i Exercise 22.8.1 Sappose someone is trying to sell you a coin that favors heads. You snwch a cotm,...
Please attempt at problem dealing in Chi-Square (Goodness of Fit).
Thank you
006Chapter 22 Exercise employment has acualy increased in the past 3 years, or whether the change in empleymens can be explained by random puecruations: What is a Type I error in this case? Whar is a Tipe Il error? 22.8.10 Imagine you are performing a statistical test to determine i Exercise 22.8.1 Sappose someone is trying to sell you a coin that favors heads. You snwch a cotm,...
Most questions answered within 3 hours.
-
Engineers must consider the breadths of male heads when
designing helmets. The company researchers have determined...
asked 10 minutes ago -
In the Williamson Ether Synthesis of Phenacetin from
Acetaminophen, sodium methoxide in methanol and 100% ethanol...
asked 15 minutes ago -
If the spin of the earth suddenly changed to spin in the
opposite direction, what effect...
asked 29 minutes ago -
An orb weaver spider with a mass of 0.23 grams hangs vertically
by one of its...
asked 25 minutes ago -
Determine the sample size required to estimate the mean score on
a standardized test within
2...
asked 47 minutes ago -
The idea that one can remain relatively 'anonymous' on the
internet if they so choose, for...
asked 34 minutes ago -
In the reaction of N2 and H2 to produce
NH3, how many moles of H2 will...
asked 35 minutes ago -
When a certain coin is flipped, the probability of
obtaining a tails is 0.55. Which of...
asked 33 minutes ago -
Can you show how a sulfonic acid group
is introduced into an aromatic ring by Friedal...
asked 38 minutes ago -
Implement the Smith-Waterman algorithm in C that accepts a
substitution matrix.
You may assume the substitution...
asked 38 minutes ago -
The equilibrium constant Kp for the reaction
C(s)+H2O(g)⇌CO(g)+H2(g) is 2.44 at 1000 K. What are the...
asked 50 minutes ago -
HACKING
1: Discuss the tricks of hacking in 300 words.
2: Explain in you own words...
asked 51 minutes ago