Based on the three scatter plots, which show correlations between two variables X and Y, which...
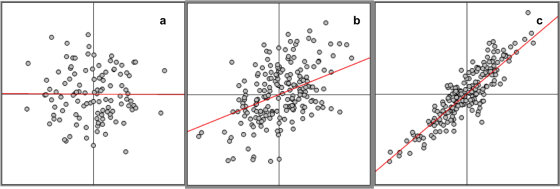
Based on the three scatter plots, which show correlations between two variables X and Y, which one of the following statements is correct?
| The relative magnitude of the three correlations is a < b < c. |
| The relative magnitude of the three correlations is a = b < c.. |
| Scatter plot a shows a strong positive correlation |
| Scatter plot c shows a weak positive correlation. |
Homework Answers

Add Answer to:
Based on the three scatter plots, which show correlations
between two variables X and Y, which...
QUESTION 6 Suppose the correlation coefficient between two variables is found to be -0.94. Which of...
 QUESTION 6 Suppose the correlation coefficient between two variables is found to be -0.94. Which of the following statements are true? there is a strong tendency for small values of one variable to be associated with large values of the other variable there is a weak negative relationship between the variables a scatter plot of the data points would show a clear downward trend there is a strong tendency for low values of one variable to be paired with low...
1. construct a scatter plot for the variables 2. compute the value of the correlation coefficient...
1. construct a scatter plot for the variables 2. compute the value of the correlation coefficient 3. give an explanation of the type nof relationship that exists between the two variables. The explanation should be a short paragraph. In this paragraph inclue the following: *say whether the is a strong positiv elinear correlation, weak positive linear correlation, strong ngative linear correlation, weak negative correlation, or no linear correlation between the two variables. *explain how you can see this from the...
Scatter plots are used to discover relationships between variables. Using the corresponding measurements of variable 1...
Scatter plots are used to discover relationships between variables. Using the corresponding measurements of variable 1 and variables 2 in DATA, plot variable 1 vs. variable 2 and describe the correlation between variable 1 and variable 2. variable1 variable2 -0.21582 0.89369 0.56997 -0.72620 -0.54850 -0.09185 -0.12385 0.50086 0.06975 -0.73607 0.16327 0.88498 -0.72595 -0.27512 0.22500 0.62647 -0.40463 0.92432 0.67652 0.56368 -0.82322 0.73005 0.06747 -0.74824 0.74055 0.79412 -0.71577 -0.04509 -0.82231 -0.70951 -0.47603 0.01573 0.58094 0.51169 -0.58573 0.10376 0.19003 -0.90089 -0.49528 0.04767 0.93083...
Which of the following statements is correct? a. The stronger the linear relationship between two variables,...
Which of the following statements is correct? a. The stronger the linear relationship between two variables, the closer the correlation coefficient will be to 1.0. b. Two variables that are uncorrelated with one another may still be related in a nonlinear manner. c. A scatter plot showing two variables with a positive linear relationship will have all points on a straight line. d. All of the above are correct.
Discuss an alternative scenario to represent the data in the scatter plots. In this scenario, assume...
 Discuss an alternative scenario to represent the data in
the scatter plots. In this scenario, assume there is correlation
but where it would be inappropriate to conclude
causation.
In the first scatter plot, the points represent numbers of
customers conducting business during the timeline of the
quarantine. X- axis being number of weeks projected for duration of
quarantine and Y- axis representing customers that are requesting
services. The first scatter plot shows that there is a positive
linear correlation between...
Discuss an alternative scenario to represent the data in
the scatter plots. In this scenario, assume there is correlation
but where it would be inappropriate to conclude
causation.
In the first scatter plot, the points represent numbers of
customers conducting business during the timeline of the
quarantine. X- axis being number of weeks projected for duration of
quarantine and Y- axis representing customers that are requesting
services. The first scatter plot shows that there is a positive
linear correlation between...
D Question 10 2 pts Which of the following shows correlations for two scatter plots? (in order) d. 0.5,-0.5 a.-0.5, 1 c. 0.5, 1 b.-0.5,0.5 D Question 10 2 pts Which of the following shows correl...
 D Question 10 2 pts Which of the following shows correlations for two scatter plots? (in order) d. 0.5,-0.5 a.-0.5, 1 c. 0.5, 1 b.-0.5,0.5
D Question 10 2 pts Which of the following shows correlations for two scatter plots? (in order) d. 0.5,-0.5 a.-0.5, 1 c. 0.5, 1 b.-0.5,0.5
D Question 10 2 pts Which of the following shows correlations for two scatter plots? (in order) d. 0.5,-0.5 a.-0.5, 1 c. 0.5, 1 b.-0.5,0.5
For the following data (a) display the data in a scatter plot, (b) calculate the correlation...
 For the following data (a) display the data in a scatter plot, (b) calculate the correlation coefficient r, and (c) make a conclusion about the type of correlation. The ages (in years) of 6 children and the number of words in their vocabulary Age, x 1. 2 3 4 5 6 Vocabulary size, y 500 450 1350 1750 2300 2300 (a) Choose the correct scatter plot below. A. B. c. D. 2350+.. 7 2350- 2350- Vocabulary Age Vocabulary Vocabulary ....
Suppose that two variables, x and y, have a correlation coefficient of 0.27. Which of the...
 Suppose that two variables, x and y, have a correlation coefficient of 0.27. Which of the following statements are true? You must make a selection for each option. Click once to place a check mark for correct answers and click twice to empty the box for the wrong answers. The variables have a positive linear relationship. There is a weak relationship between these two variables. There is a strong relationship between these two variables As xincreases, y decreases. As x...
Degree of Correlation For each plot use one of the terms in the word bank to...
 Degree of Correlation For each plot use one of the terms in the word bank to describe the plot. Word Bank: strong positive, weak positive, strong negative, moderate negative, weak negative, no. Plot A show a linear relationship between variables x and y. Plot B show a linear relationship between variables x and y. Plot C show a linear relationship between variables x and y. Plot D show a linear relationship between variables x and y. Plot E show a...
For the following data (a) display the data in a scatter plot, (b) calculate the sample...
For the following data (a) display the data in a scatter plot, (b) calculate the sample correlation coefficient r, and (c) make a conclusion about the type of correlation. Use technology. The earnings per share (in dollars) and the dividends per share (in dollars) for six medical supplies companies in a recent year are shown in the data set below. a) choose the correct scatter plot. Use technology. (b) The correlation coefficient r is _____ (Round to three decimal places...
 QUESTION 6 Suppose the correlation coefficient between two variables is found to be -0.94. Which of the following statements are true? there is a strong tendency for small values of one variable to be associated with large values of the other variable there is a weak negative relationship between the variables a scatter plot of the data points would show a clear downward trend there is a strong tendency for low values of one variable to be paired with low...
 Discuss an alternative scenario to represent the data in
the scatter plots. In this scenario, assume there is correlation
but where it would be inappropriate to conclude
causation.
In the first scatter plot, the points represent numbers of
customers conducting business during the timeline of the
quarantine. X- axis being number of weeks projected for duration of
quarantine and Y- axis representing customers that are requesting
services. The first scatter plot shows that there is a positive
linear correlation between...
Discuss an alternative scenario to represent the data in
the scatter plots. In this scenario, assume there is correlation
but where it would be inappropriate to conclude
causation.
In the first scatter plot, the points represent numbers of
customers conducting business during the timeline of the
quarantine. X- axis being number of weeks projected for duration of
quarantine and Y- axis representing customers that are requesting
services. The first scatter plot shows that there is a positive
linear correlation between...
 D Question 10 2 pts Which of the following shows correlations for two scatter plots? (in order) d. 0.5,-0.5 a.-0.5, 1 c. 0.5, 1 b.-0.5,0.5
D Question 10 2 pts Which of the following shows correlations for two scatter plots? (in order) d. 0.5,-0.5 a.-0.5, 1 c. 0.5, 1 b.-0.5,0.5
D Question 10 2 pts Which of the following shows correlations for two scatter plots? (in order) d. 0.5,-0.5 a.-0.5, 1 c. 0.5, 1 b.-0.5,0.5
 For the following data (a) display the data in a scatter plot, (b) calculate the correlation coefficient r, and (c) make a conclusion about the type of correlation. The ages (in years) of 6 children and the number of words in their vocabulary Age, x 1. 2 3 4 5 6 Vocabulary size, y 500 450 1350 1750 2300 2300 (a) Choose the correct scatter plot below. A. B. c. D. 2350+.. 7 2350- 2350- Vocabulary Age Vocabulary Vocabulary ....
 Suppose that two variables, x and y, have a correlation coefficient of 0.27. Which of the following statements are true? You must make a selection for each option. Click once to place a check mark for correct answers and click twice to empty the box for the wrong answers. The variables have a positive linear relationship. There is a weak relationship between these two variables. There is a strong relationship between these two variables As xincreases, y decreases. As x...
 Degree of Correlation For each plot use one of the terms in the word bank to describe the plot. Word Bank: strong positive, weak positive, strong negative, moderate negative, weak negative, no. Plot A show a linear relationship between variables x and y. Plot B show a linear relationship between variables x and y. Plot C show a linear relationship between variables x and y. Plot D show a linear relationship between variables x and y. Plot E show a...
Most questions answered within 3 hours.
-
A .15kg rubber ball is bounced off a wall. Before hitting the
wall, the ball moves...
asked 29 minutes ago -
A manufacturing company preparing to build a new plant is
considering three potential locations for it....
asked 31 minutes ago -
B. If compound Y has approximately the same values of solubility
in toluene as compound X,...
asked 1 hour ago -
Oscar Inc. has inventory in Japan valued at 39,051,000 Yen one
year ago. One year ago...
asked 1 hour ago -
If Canada suffered from "fundamental disequilibrium," and its
government choose not to devalue its currency, a...
asked 1 hour ago -
4. How many input & output Key Value Pairs are passed into,
and emitted out of...
asked 1 hour ago -
Why would your heart not function well if constructed of
skeletal muscle? What is the particular...
asked 1 hour ago -
Please respond to this essay question in full essay form for
Chemistry 1102 Organic and Biochemistry:...
asked 1 hour ago -
Determine the head loss and velocity of flow in a water supply main
of 15.0 cm...
asked 1 hour ago -
A marketing executive who knowingly authorizes a shoddy
defective product to be brought to market is...
asked 1 hour ago -
Write a psudocode:
1. Define a function called authorize that takes in 2 strings,
uName, and...
asked 1 hour ago -
What Hall voltage (in mV) is produced by a 0.180 T field applied
across a 2.60...
asked 1 hour ago