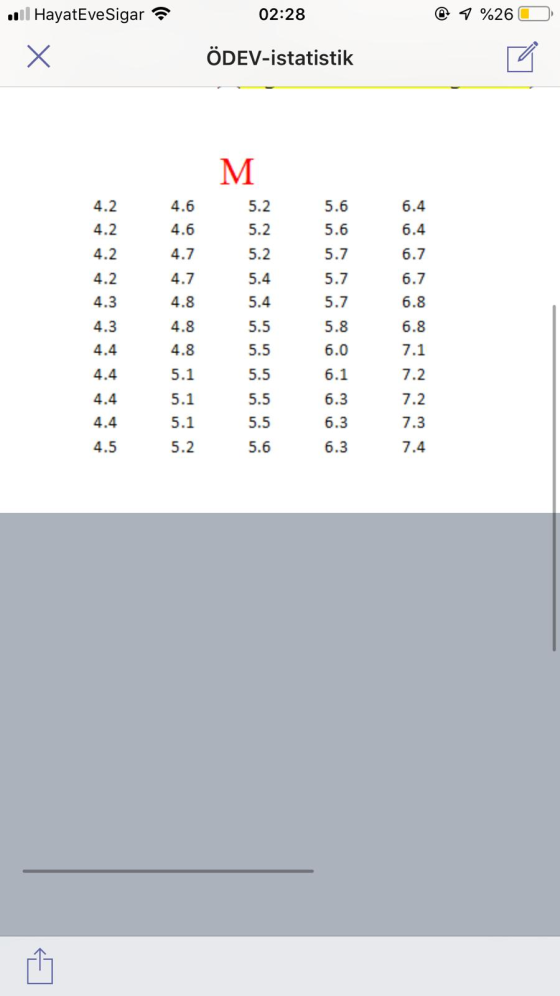
n the table below, earthquake magnitudes are given for any region for the last 100 years. Convert each value in this table to your own values to get a new table.
your new values
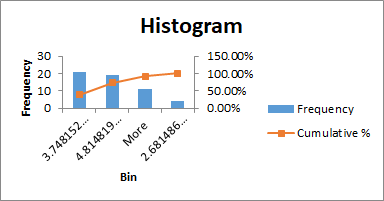
- A) frequency table and create histogram find
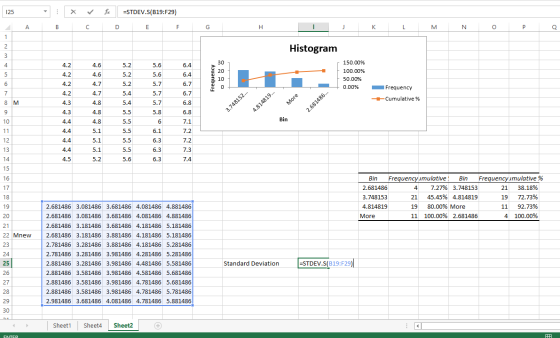
B)standard deviation, find values
C) ,%variation coefficients find values
D) mode and median find values
use the formula below for conversion
Mnew=M-log10(N)
N=33
please show which item you solved when solving
Sample (A B C D)
single digit after comma
Homework Answers
The values are converted first, as follows:

press F2= to enter the formula after selecting 5x11 cells for accomodating the new values
press Ctrl+Shift+Enter to get the updated values
A)
Use the data analysis option and select 'Histogram' to get the given dialog box.
check the three boxes
Select the input range by selecting the complete data
Select some blank cells to accommodate the output data in the Output Range option


B) Use STDEV.S function to find the standard deviation as shown below:
C) To find the coefficient of variation, we have to find the mean of the data using average function since,
CV=SD/mean


D) The 'MEDIAN' function is used to find the median as shown:

'MODE' function is used to find the mode of the given data as shown below:

FINAL RESULTS:

Add Answer to:
n the table below, earthquake magnitudes are given for any
region for the last 100 years....
Parametirc test or not: Test statistic: p-value: decision: Is There A Difference Between the Means?
Parametirc test or not:Test statistic:p-value:decision:Is There A Difference Between the Means?6.7 6.2 3.1 310.3 10 5 5.56.9 5.5 3.3 3.110.5 6.3 4.3 5.44.5 4.6 1.8 25.6 5.6 2 2.65.9 6.1 2.1 2.58 11.7 4 4.68 7.4 3.3 3.15.8 5.2 3.1 2.96 7.3 3.0 3.28.7 5.3 2.7 36 5.5 2.1 2.27.2 6.3 3.5 3.25.9 4.6 2.9 3.46 7.4 3 3.37.2 7.8 3.7 3.48.6 9.4 5.1 5.77.2 8.1 2.8 3.15.8 5.4 2.2 1.83.3 4 1.7 1.86.8 5.1 2 1.83.7 3.5 2.2 2.112...
Bivariate data for the quantitative variables x and y are given in the table below. These...
 Bivariate data for the quantitative variables x and y are given in the table below. These data are plotted in the scatter plot shown next to the table. In the scatter plot, sketch an approximation of the least squares regression line for the data. y 3.4 4.8 11+ 10+ х ? 3.2 5.9 4.4 3 8.7 6.4 2.7 10.5 5.1 7.6 7.3 6.2 2.8 5.5 1.4 6.6 7.0 6.9 5.8 5.7 3.2 8.1 6.2 4.2 5.2 9.5 2.2
The data on the below shows the number of hours a particular drug is in the...
The data on the below shows the number of hours a particular drug is in the system of 200 females. Develop a histogram of this data according to the following intervals: Follow the directions. Test the hypothesis that these data are distributed exponentially. Determine the test statistic. Round to two decimal places. (sort the data first) [0, 3) [3, 6) [6, 9) [9, 12) [12, 18) [18, 24) [24, infinity) 34.7 11.8 10 7.8 2.8 20 9.8 20.4 1.2 7.2...
(a) A recent study of home technologies reported (as per the following table) the number of...
(a) A recent study of home technologies reported (as per the following table) the number of hours of personal computer usage per week for a sample of 60 persons. 9.3 5.3 6.3 8.8 6.5 0.6 5.2 6.6 9.3 4.3 6.3 2.1 2.7 0.4 3.7 3.3 1.1 2.7 6.7 6.5 4.3 9.7 7.7 5.2 1.7 8.5 4.2 5.5 5.1 5.6 5.4 4.8 2.1 10.1 1.3 5.6 2.4 2.4 4.7 1.7 2.0 6.7 1.1 6.7 2.2 2.6 9.8 6.4 4.9 5.2 4.5...
A comparison was made of the average length of stay (in days) for the years 2000,...
A comparison was made of the average length of stay (in days) for the years 2000, 2005, 2010, and 2015 between males and females (ages 45–64) for seven diagnoses. The data indicates: 2000 2005 2010 2015 Males: Malignant Neoplasm 9.2 9.4 8.2 7.0 Diabetes Mellitus 7.9 7.3 6.6 6.5 Diseases of the Heart 6.5 5.8 5.0 4.8 Cerebrovascular disease 10.2 10.0 6.2 6.8 Pneumonia 8.0 7.9 7.2 6.9 Injuries and poisoning 6.6 7.2 5.8 5.5 Fractures 7.5 7.2 6.7 6.3...
Saved 2023 A sample of 100 bank customer waiting times are given in the following table:...
 Saved 2023 A sample of 100 bank customer waiting times are given in the following table: Waiting Times (in Minutes) for the Bank Custoner Waiting Tine Case 4.5 9.7 11.8 10.4 4.2 7.e 5.5 8.7 8.8 5.1 5.4 4.5 6.2 3.9 8.7 7.6 4.7 4.0 4.0 10.1 .3 2.8 5.4 6.5 9.7 5.2 7.0 5.8 4.5 8.2 1.9 5.2 4.1 7.9 5.3 8.8 6.2 4.1 4.1 4.5 10.4 .2 7.0 6.8 5.5 8.3 11.3 5.9 8.8 2.8 6.7 5.5 5.e...
A comparison was made of the average length of stay (in days) for the years 2000,...
A comparison was made of the average length of stay (in days) for the years 2000, 2005, 2010, and 2015 between males and females (ages 45–64) for seven diagnoses. The data indicates: 2000 2005 2010 2015 Males: Malignant Neoplasm 9.2 9.4 8.2 7.0 Diabetes Mellitus 7.9 7.3 6.6 6.5 Diseases of the Heart 6.5 5.8 5.0 4.8 Cerebrovascular disease 10.2 10.0 6.2 6.8 Pneumonia 8.0 7.9 7.2 6.9 Injuries and poisoning 6.6 7.2 5.8 5.5 Fractures 7.5 7.2 6.7 6.3...
An object of weight 1 N is falling vertically. The time vs. speed data can be...
An object of weight 1 N is falling vertically. The time vs. speed data can be found here. In this case the effect of air-drag cannot be neglected. Use your critical thinking to estimate the air-drag coefficient . Make sure you include the units in your answer. 0 0 0.1 0.9992 0.2 1.993 0.3 2.978 0.4 3.948 0.5 4.898 0.6 5.826 0.7 6.728 0.8 7.599 0.9 8.438 1 9.242 1.1 10.01 1.2 10.74 1.3 11.43 1.4 12.09 1.5 12.7 1.6 ...
11.38 Building a multiple linear regression model. Let’s now build a model to predict the life-satisfaction...
11.38 Building a multiple linear regression model. Let’s now build a model to predict the life-satisfaction score, LSI. (a) Consider a simple linear regression using GINI as the explanatory variable. Run the regression and summarize the results. Be sure to check assumptions. (b) Now consider a model using GINI and LIFE. Run the multiple regression and summarize the results. Again be sure to check assumptions. (c) Now consider a model using GINI, LIFE, and DEMOCRACY. Run the multiple regression and...
Consider the accompanying observations on bond strength. 9.8 9.1 7.9 5.9 6.3 5.6 5.5 11.3 12.3...
 Consider the accompanying observations on bond strength. 9.8 9.1 7.9 5.9 6.3 5.6 5.5 11.3 12.3 13.5 17.3 4.7 10.8 3.7 3.2. 8.4 10.5 5.1 4.6 9.4 15.1 20.5 14.1 4.0 8.4 4.4 25.4 13.7 7.5 5.1 4.1 12.7 5.7 3.5 6.8 7.2 5.1 4.9 4.0 3.7 13.3 8.8 5.0 5.2 4.0 3.6 3.4 3.7 (a) Estimate true average bond strength in a way that conveys information about precision and reliability. (Hint: < x;= 387.8 and *? = 4,246.2.) (Round...
 Bivariate data for the quantitative variables x and y are given in the table below. These data are plotted in the scatter plot shown next to the table. In the scatter plot, sketch an approximation of the least squares regression line for the data. y 3.4 4.8 11+ 10+ х ? 3.2 5.9 4.4 3 8.7 6.4 2.7 10.5 5.1 7.6 7.3 6.2 2.8 5.5 1.4 6.6 7.0 6.9 5.8 5.7 3.2 8.1 6.2 4.2 5.2 9.5 2.2
 Saved 2023 A sample of 100 bank customer waiting times are given in the following table: Waiting Times (in Minutes) for the Bank Custoner Waiting Tine Case 4.5 9.7 11.8 10.4 4.2 7.e 5.5 8.7 8.8 5.1 5.4 4.5 6.2 3.9 8.7 7.6 4.7 4.0 4.0 10.1 .3 2.8 5.4 6.5 9.7 5.2 7.0 5.8 4.5 8.2 1.9 5.2 4.1 7.9 5.3 8.8 6.2 4.1 4.1 4.5 10.4 .2 7.0 6.8 5.5 8.3 11.3 5.9 8.8 2.8 6.7 5.5 5.e...
 Consider the accompanying observations on bond strength. 9.8 9.1 7.9 5.9 6.3 5.6 5.5 11.3 12.3 13.5 17.3 4.7 10.8 3.7 3.2. 8.4 10.5 5.1 4.6 9.4 15.1 20.5 14.1 4.0 8.4 4.4 25.4 13.7 7.5 5.1 4.1 12.7 5.7 3.5 6.8 7.2 5.1 4.9 4.0 3.7 13.3 8.8 5.0 5.2 4.0 3.6 3.4 3.7 (a) Estimate true average bond strength in a way that conveys information about precision and reliability. (Hint: < x;= 387.8 and *? = 4,246.2.) (Round...
Most questions answered within 3 hours.
-
Find the mid-range for the given sample data. Listed
below are the amounts of time (in...
asked 54 seconds from now -
A proposal to your local city council in which you propose how
to use the money...
asked 6 minutes ago -
Book co. has 1.0 million shares of common stock equity with a
par (book) value of...
asked 10 minutes ago -
Find the force, in N, required to tow a plate (0.5 m x 2 m) at...
asked 13 minutes ago -
When submitting the completed project, please show all work and
number each answer accordingly.
When calculating...
asked 10 minutes ago -
Eagle Industries feels that a lockbox system can shorten its
accounts receivable collection period by 2...
asked 29 minutes ago -
A block measures 5.5 cm on each side. What is the volume of the
block in...
asked 29 minutes ago -
what are the differences between these?
a. shear force.
b. shear stress.
c. Bending Moment.
d....
asked 38 minutes ago -
The proportion of adult women in a certain geographical region
is approximately 51%. A marketing survey...
asked 46 minutes ago -
I am trying to answer a question that is asking why there was no
evidence of...
asked 56 minutes ago -
Power elecrtonics: buck converter?
Calculate and plot (via excel/MATLAB) the average V(out) of a
buck converter...
asked 57 minutes ago -
PLEASE USE PYTHON
training error should strictly decrease as the degree of the
hypothesis polynomials increases....
asked 1 hour ago