In a pair-matched case-control study of risk factors for carcinoma, dietary history of 30 patients with...
In a pair-matched case-control study of risk factors for carcinoma, dietary history of 30 patients with the disease and 30 control subjects were collected. Below is a table that summarizes their history of corn and corn oil consumption.
| Pairs | Cases - Carcinoma patients | Controls - healthy subjects |
| 1 | Yes | Yes |
| 2 | Yes | Yes |
| 3 | Yes | Yes |
| 4 | Yes | Yes |
| 5 | Yes | Yes |
| 6 | Yes | Yes |
| 7 | Yes | No |
| 8 | Yes | No |
| 9 | Yes | No |
| 10 | Yes | No |
| 11 | Yes | No |
| 12 | Yes | No |
| 13 | Yes | No |
| 14 | Yes | No |
| 15 | Yes | No |
| 16 | Yes | No |
| 17 | Yes | No |
| 18 | Yes | No |
| 19 | Yes | No |
| 20 | No | No |
| 21 | No | No |
| 22 | No | No |
| 23 | No | No |
| 24 | No | No |
| 25 | No | No |
| 26 | No | Yes |
| 27 | No | Yes |
| 28 | No | Yes |
| 29 | No | Yes |
| 30 | No | Yes |
a. What is estimated odds ratio? what is the 95% confidence interval of population odds ratio?
b. Perform hypothesis test and see if there is any difference in efficacy between two treatments. level of sig - 0.05. state null and alternate hypothesis, test statistic, p value and your conclusion.
Homework Answers
This is the question of case-control data where the counts in this table(table structured using the information above) represent the number of pairs and not the number of individuals.
| Cases/control | Yes | No |
| Yes | 6 | 13 |
| No | 5 | 6 |
No. of Yes-yes pairs are 6, No. of Yes-No pairs are 13, No. of No-Yes pairs are 5, No. of No-No pairs are 6 (from the information provided in the question)
a) Here Yes-Yes and No-No are known as the concordant pairs of the sample and Yes-No and No-Yes are known as discordant pairs. Although there are N = 30 pairs but we are only interested in the discordant pairs which are u = 13 and v = 5.
Odds Ratio = 
The confidence interval for odds-ratio = 
where z = 1.96 at 95% level of confidence.
Now first let us find 
= 
= 0.526
Now we will calculate the CI for odds ratio= 
= 
= -0.076,1.99
Hence the 95% confidence interval for case control data's odd ratio is [-0.076,1.99].
b) Also, When the number of discordant pairs (u + v) is 10 or greater, you can test H0: OR = 1 with McNemar’s chi-square statistic.
Since u+v = 13+5 = 18
H0: OR = 1
H1: OR > 1
The regular and continuity-correct McNemar’s chi squares are shown below:

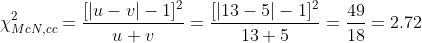
Because of the relation between the chi-square distributions and z distributions, the above formulas can be re-expressed:


Add Answer to:
In a pair-matched case-control study of risk factors for
carcinoma, dietary history of 30 patients with...
The Black Women's Health Study, a study of risk factors for coronary heart disease in African...
The Black Women's Health Study, a study of risk factors for coronary heart disease in African American women, consisted of 352 women who reported having had a heart attack (cases), who were matched on age with 1760 controls (Am J Epi 1999; 150:904-909). The following data summarize some of the findings. History of Heart Attack in a Parent Case Control Total No 169 1082 1251 Yes: at age 50+ 91 329 420 Yes: before age 50 53 106 159 Total...
Control subjects for the case-control study were randomly selected from local telephone directories and were matched...
Control subjects for the case-control study were randomly selected from local telephone directories and were matched to case-patients according to the following criteria: the same sex and telephone exchange, and age within 10 years of the corresponding patient if the patient was 30 years of age or older, and within 5 years if the patient was under 30 years of age. Just as the case-control study was getting under way, a new case-patient was diagnosed in Sioux Falls and was...
Lung Cancer & Smoking Case Study A causal relationship between cigarette smoking and lung cancer was...
 Lung Cancer & Smoking Case Study A causal relationship between cigarette smoking and lung cancer was first suspected in the 1920s on the basis of clinical observations. To test this apparent association, numerous epidemiologic studies were undertaken between 1930 and 1960. Two studies were conducted by Richard Doll and Austin Bradford Hill in Great Britain The first was a case-control study begun in 1947 comparing the smoking habits of lung cancer patients with the smoking habits of other patients. The...
 Lung Cancer & Smoking Case Study A causal relationship between cigarette smoking and lung cancer was first suspected in the 1920s on the basis of clinical observations. To test this apparent association, numerous epidemiologic studies were undertaken between 1930 and 1960. Two studies were conducted by Richard Doll and Austin Bradford Hill in Great Britain The first was a case-control study begun in 1947 comparing the smoking habits of lung cancer patients with the smoking habits of other patients. The...
Most questions answered within 3 hours.
-
5. Explain the condition for a DC motor to develop the
maximum power. If a DC...
asked 4 minutes ago -
Compute the p[Ag] after 35.00 mL of 0.1 M silver nitrate has been
added to the...
asked 7 minutes ago -
Walgreen Company (NYSE: WAG) is currently trading at $48.50 on
the NYSE. Walgreen Company is also...
asked 21 minutes ago -
Based on historical data, your team knows what proportion of the
company's orders come from Males...
asked 39 minutes ago -
8. Which of the following atoms has the largest magnitude
electron affinity?
(a) Sodium (Na)
(b)...
asked 41 minutes ago -
Assess the two types of tests of cognitive abilities. (
regarding HR course)
asked 46 minutes ago -
1.Write an inspiring vision statement for an organization where
you work or have worked. If the...
asked 48 minutes ago -
2. Is fair trade coffee sustainable for the mass market,
or is it a niche product...
asked 48 minutes ago -
Please answer this asap in MATLAB.
In the following for loop, the the loop is executed...
asked 1 hour ago -
A 50.0-g golf ball is driven from the tee with an initial speed
of 44.6 m/s...
asked 55 minutes ago -
Use the molar concentration of the 50 mL solution to calculate
the moles of Cr(III) in...
asked 58 minutes ago -
Calculate the molarity of Fe3+ in solution A.
Solution A: 10 mL of 0.0600 M Fe(No3)3 ...
asked 1 hour ago