x 10 8 13 9 11 14 6 4 12 7 5 y 9.14 8.13 8.75...
|
x |
10 |
8 |
13 |
9 |
11 |
14 |
6 |
4 |
12 |
7 |
5 |
|
|---|---|---|---|---|---|---|---|---|---|---|---|---|
|
y |
9.14 |
8.13 |
8.75 |
8.76 |
9.26 |
8.09 |
6.13 |
3.11 |
9.13 |
7.26 |
4.73 |
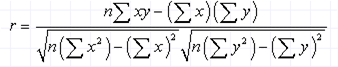
b. Find the linear correlation coefficient, r, then determine whether there is sufficient evidence to support the claim of a linear correlation between the two variables.
The linear correlation coefficient is r =?
Homework Answers
Solution:
| X | Y | XY | X^2 | Y^2 |
| 10 | 9.14 | 91.4 | 100 | 83.5396 |
| 8 | 8.13 | 65.04 | 64 | 66.0969 |
| 13 | 8.75 | 113.75 | 169 | 76.5625 |
| 9 | 8.76 | 78.84 | 81 | 76.7376 |
| 11 | 9.26 | 101.86 | 121 | 85.7476 |
| 14 | 8.09 | 113.26 | 196 | 65.4481 |
| 6 | 6.13 | 36.78 | 36 | 37.5769 |
| 4 | 3.11 | 12.44 | 16 | 9.6721 |
| 12 | 9.13 | 109.56 | 144 | 83.3569 |
| 7 | 7.26 | 50.82 | 49 | 52.7076 |
| 5 | 4.73 | 23.65 | 25 | 22.3729 |
| n | 11 |
| sum(XY) | 797.40 |
| sum(X) | 99.00 |
| sum(Y) | 82.49 |
| sum(X^2) | 1001.00 |
| sum(Y^2) | 659.82 |
| Numerator | 604.89 |
| Denominator | 740.69 |
| r | 0.8167 |
| r square | 0.6669 |
| Xbar(mean) | 9.0000 |
| Ybar(mean) | 7.4991 |
| SD(X) | 2.1148 |
| SD(Y) | 0.4490 |
| b | 0.4999 |
| a | 2.9999 |
The linear correlation coefficient is r = 0.8167.
Use the given data set to complete parts (a) through (c) below. (Use a=0.05.) X: 10...
Use the given data set to complete parts (a) through (c) below. (Use a=0.05.) X: 10 8 13 9 11 14 6 4 12 7 5 Y: 9.14 8.15 8.74 8.78 9.26 8.11 6.13 3.11 9.13 7.26 4.74 The linear correlation coefficient is r= Determine whether there is sufficient evidence to support the claim of a linear correlation between two variables. Identify the feature of the data that would be missed if part b was completed with out the construction...
Use the given data set to complete parts (a) through (c) below. (Use a = 0.05.)...
 Use the given data set to complete parts (a) through (c) below. (Use a = 0.05.) X 8 10 9.14 13 8.75 9 8.78 11 9.26 14 8.11 6 6.13 4 3.11 12 9.13 7 7.26 5 4.74 y 8.13 Click here to view a table of critical values for the correlation coefficient. a. Construct a scatterplot. Choose the correct graph below. OA. OB. OC. OD. AY 10 Ау 10- 8- AY 10- 8- 6- 4- 6- ......... 8- 6-...
Use the given data set to complete parts (a) through (c) below. (Use a = 0.05.)...
 Use the given data set to complete parts (a) through (c) below. (Use a = 0.05.) x v 10 9.14 8 8.13 13 8.74 9 8.77 11 9.27 14 8.09 6 6.13 4 3.09 12 9.13 7 7.26 5 4.75 1 | 3 Click here to view a table of critical values for the correlation coefficient. a. Construct a scatterplot. Choose the correct graph below. O A. O toot'n'to * TAŚ 12 16 d's 12' 16' °C 8 12 16...
Use the given data set to complete parts (a) through (c) below. (Use a-0.05.) 10 9.13...
 Use the given data set to complete parts (a) through (c) below. (Use a-0.05.) 10 9.13 13 8.75 12 9.13 3.11 4.74 8.14 8.77 9.25 8.09 6.13 7.25 Click here to view a table of critical values for the correlation coefficient. a. Construct a scatterplot. Choose the correct graph below. OA. OB. O C. OD. 12 16 12 16 8 12 16 12 16 b. Find the linear correlation coefficient, r, then determine whether there is sufficient evidence to support...
Use the given data set to complete parts (a) through (c) below. (Use a = 0.05.)...
 Use the given data set to complete parts (a) through (c) below. (Use a = 0.05.) 5 х у 10 9.14 8 8.14 13 8.73 9 8.76 11 9.26 14 8.09 6 6.13 4 3.09 12 9.13 7 7.25 4.73 Click here to view a table of critical values for the correlation coefficient. a. Construct a scatterplot. Choose the correct graph below. OA. OB. O c. OD y AY 10- 8- Ay 10-1 a 10- 10- 8- 6- 8-1 8-...
Use the given data set to complete parts (a) through (C) below. (Use a = 0.05.)...
 Use the given data set to complete parts (a) through (C) below. (Use a = 0.05.) 10 9.14 8 8.15 13 8.74 9 8.77 11 9.27 14 8.09 6 6.13 4 3.09 12 9.13 5 4.75 7.26 Click here to view a table of critical values for the correlation coefficient. a. Construct a scatterplot. Choose the correct graph below. OA OB. OC. OD. AY 10- 8 10- 10 8 10- 8- 6 6- 6- . 6- 4 4 4- 4...
Use the given data set to complete parts (a) through (c) below. (Use a=0.05.) n х...
 Use the given data set to complete parts (a) through (c) below. (Use a=0.05.) n х 10 9.14 8 8.14 13 8.74 11 9.26 14 8.11 6 6.13 4 3.11 12 9.12 7 7.26 5 4.75 y 8.77 Click here to view a table of critical values for the correlation coefficient. a. Construct a scatterplot. Choose the correct graph below. O A. B. D Ay 10- AY 10- 8 лу 10- AY 10- 8- 8- 8- 6- 6- 6- 6-...
4 Scatterplots Match these values of r with the five scatterplots shown here and the next page: 0...
 4 Scatterplots Match these values of r with the five scatterplots shown here and the next page: 0.268, 0992.-1, 0.746, and 1 . on y 14 12 00 a1 02 30405 0.6 0.7 0.8 0.9 OS 0.6 07 Graphs in Statistical A plore! Exercises 9 and 10 provide two data sets from " by E J. Anscombe, The American Statistician, Vol. 27. For each exercise a. Construct a scatterplot b. Find the value of the linear correlation coefficient r, then...
so the given data set to complete parts (a) through (c) below. (Use q=0.06.) Question Help...
 so the given data set to complete parts (a) through (c) below. (Use q=0.06.) Question Help x у 10 9.13 8 8.13 13 8.74 9 8.76 11 925 14 8.11 6 6.14 4 3.11 12 9.13 7 7.26 473 Click here to view a table of critical values for the correlation coefficient. a. Construct a scatterplot. Choose the correct graph below. A OB Ос. OD Ay 10 @ 10 8 10 A 5 ******** 4 Ау 10 8 6 4...
Use the given data set to complete parts (a) through (c) below. (Use a = 0.05.)...
 Use the given data set to complete parts (a) through (c) below. (Use a = 0.05.) X 10 9.15 8 8.15 13 8.74 9 8.78 11 9.26 14 8.11 6 6.14 4 3.09 12 9.13 7 7.26 5 4.73 y Click here to view a table of critical values for the correlation coefficient. 10 10- 10- 104 8- 8- 8- 8- . 6- 6- 6- 6- 4- 4- 4- 4- . 2- 2- 2- 2- х х 0 0- 0...
 Use the given data set to complete parts (a) through (c) below. (Use a = 0.05.) X 8 10 9.14 13 8.75 9 8.78 11 9.26 14 8.11 6 6.13 4 3.11 12 9.13 7 7.26 5 4.74 y 8.13 Click here to view a table of critical values for the correlation coefficient. a. Construct a scatterplot. Choose the correct graph below. OA. OB. OC. OD. AY 10 Ау 10- 8- AY 10- 8- 6- 4- 6- ......... 8- 6-...
 Use the given data set to complete parts (a) through (c) below. (Use a = 0.05.) x v 10 9.14 8 8.13 13 8.74 9 8.77 11 9.27 14 8.09 6 6.13 4 3.09 12 9.13 7 7.26 5 4.75 1 | 3 Click here to view a table of critical values for the correlation coefficient. a. Construct a scatterplot. Choose the correct graph below. O A. O toot'n'to * TAŚ 12 16 d's 12' 16' °C 8 12 16...
 Use the given data set to complete parts (a) through (c) below. (Use a-0.05.) 10 9.13 13 8.75 12 9.13 3.11 4.74 8.14 8.77 9.25 8.09 6.13 7.25 Click here to view a table of critical values for the correlation coefficient. a. Construct a scatterplot. Choose the correct graph below. OA. OB. O C. OD. 12 16 12 16 8 12 16 12 16 b. Find the linear correlation coefficient, r, then determine whether there is sufficient evidence to support...
 Use the given data set to complete parts (a) through (c) below. (Use a = 0.05.) 5 х у 10 9.14 8 8.14 13 8.73 9 8.76 11 9.26 14 8.09 6 6.13 4 3.09 12 9.13 7 7.25 4.73 Click here to view a table of critical values for the correlation coefficient. a. Construct a scatterplot. Choose the correct graph below. OA. OB. O c. OD y AY 10- 8- Ay 10-1 a 10- 10- 8- 6- 8-1 8-...
 Use the given data set to complete parts (a) through (C) below. (Use a = 0.05.) 10 9.14 8 8.15 13 8.74 9 8.77 11 9.27 14 8.09 6 6.13 4 3.09 12 9.13 5 4.75 7.26 Click here to view a table of critical values for the correlation coefficient. a. Construct a scatterplot. Choose the correct graph below. OA OB. OC. OD. AY 10- 8 10- 10 8 10- 8- 6 6- 6- . 6- 4 4 4- 4...
 Use the given data set to complete parts (a) through (c) below. (Use a=0.05.) n х 10 9.14 8 8.14 13 8.74 11 9.26 14 8.11 6 6.13 4 3.11 12 9.12 7 7.26 5 4.75 y 8.77 Click here to view a table of critical values for the correlation coefficient. a. Construct a scatterplot. Choose the correct graph below. O A. B. D Ay 10- AY 10- 8 лу 10- AY 10- 8- 8- 8- 6- 6- 6- 6-...
 4 Scatterplots Match these values of r with the five scatterplots shown here and the next page: 0.268, 0992.-1, 0.746, and 1 . on y 14 12 00 a1 02 30405 0.6 0.7 0.8 0.9 OS 0.6 07 Graphs in Statistical A plore! Exercises 9 and 10 provide two data sets from " by E J. Anscombe, The American Statistician, Vol. 27. For each exercise a. Construct a scatterplot b. Find the value of the linear correlation coefficient r, then...
 so the given data set to complete parts (a) through (c) below. (Use q=0.06.) Question Help x у 10 9.13 8 8.13 13 8.74 9 8.76 11 925 14 8.11 6 6.14 4 3.11 12 9.13 7 7.26 473 Click here to view a table of critical values for the correlation coefficient. a. Construct a scatterplot. Choose the correct graph below. A OB Ос. OD Ay 10 @ 10 8 10 A 5 ******** 4 Ау 10 8 6 4...
 Use the given data set to complete parts (a) through (c) below. (Use a = 0.05.) X 10 9.15 8 8.15 13 8.74 9 8.78 11 9.26 14 8.11 6 6.14 4 3.09 12 9.13 7 7.26 5 4.73 y Click here to view a table of critical values for the correlation coefficient. 10 10- 10- 104 8- 8- 8- 8- . 6- 6- 6- 6- 4- 4- 4- 4- . 2- 2- 2- 2- х х 0 0- 0...
Most questions answered within 3 hours.
-
1. An object weighing 40 N rests on a surface. The coefficient
of friction is 0.35....
asked 35 minutes ago -
Investor company owns 35% of investee company voting stock and
accounts for the investment under the...
asked 1 hour ago -
The number of major faults on a randomly chosen 1 km stretch of
highway has a...
asked 2 hours ago -
Consider the competitive environment of Starbuck's, Progressive
Insurance, a manufacturing firm with low turnover, or a...
asked 2 hours ago -
3. Gains from trade
Consider two neighbouring island countries called Euphoria and
Contente. They each have...
asked 4 hours ago -
A business executive has the option to invest money in two
plans: Plan A guarantees that...
asked 7 hours ago -
Hello, can someone please help me answer this question?
How much heat is absorbed by a...
asked 7 hours ago -
. A marketing researcher conducted a survey of 25 shoppers
randomly selected at the local mall...
asked 7 hours ago -
Create an comprehensive response to the
following:
Antimicrobial agents work on a multitude of microbes (bacteria,...
asked 7 hours ago -
6.13 LAB: Step counter. Section 6.3.
A pedometer treats walking 2,000 steps as walking 1 mile....
asked 7 hours ago -
(14.2) A block of mass m = 10 kg riding on a frictionless
horizontal plane is...
asked 7 hours ago -
Use any search engine to search for articles about Starbucks
partnership with Tata Companies in India...
asked 7 hours ago