Thanks to programming experience and language evolution, we have a rather easy fix to this problem....
Thanks to programming experience and language evolution, we have a rather easy fix to this problem. Python has another kind of data type that is exactly applicable here.
Try this example that creates what Python calls a dictionary.
days_in = {'Jan': 31, 'Feb': 28, 'Mar': 31, 'Apr': 30, 'May': 31, 'Jun': 30,
           'Jul': 31, 'Aug': 31, 'Sep': 30, 'Oct': 31, 'Nov': 30, 'Dec': 31}
The Python dictionary is actually designed specifically for associative data. See if you can figure out how to fill in this blank:
month_name = input('Abbreviated month name:  ')
month_days = days_in[ Please Enter the Answer Here ]
print(month_name,'has',month_days,'days')
Hint: The values from a dictionary are not chosen by their position within that dictionary, so this is actually much simpler than the earlier question that looked like this.
Homework Answers
CODE:
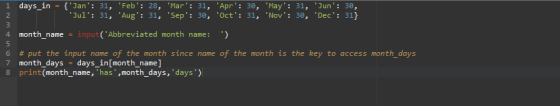
days_in = {'Jan': 31, 'Feb': 28, 'Mar': 31, 'Apr': 30, 'May':
31, 'Jun': 30,
'Jul':
31, 'Aug': 31, 'Sep': 30, 'Oct': 31, 'Nov': 30, 'Dec': 31}
month_name = input('Abbreviated month name: ')
# put the input name of the month since name of the month is the
key to access month_days
month_days = days_in[month_name]
print(month_name,'has',month_days,'days')
SCREENSHOT:
OUTPUT:

Add Answer to:
Thanks to programming experience and language evolution, we have
a rather easy fix to this problem....
The human resources department needs to forecast the number of employees at a site. The data...
 The human resources department needs to forecast the number of employees at a site. The data for several months is supplied below. Be careful since the data is listed beginning with the most recent. The forecasting method to be used here is the 7 month moving average. Please round your forecast to the nearest whole number Nov 2019: 956 Oct 2019: 1014 Sep 2019: 1009 Aug 2019: 963 Jul 2019: 966 Jun 2019: 1024 May 2019: 1045||Apr 2019: 1047 Mar...
That is the question. There's no more information I can give you about it. The information...
 That is the question. There's no more information I
can give you about it.
The information technology department needs to forecast spending on cyber security. The data for several months is supplied below. Be careful since the data is listed beginning with the most recent. The forecasting method to be used here is exponential smoothing with trend accounting for seasonality given a smoothing constant (alpha) of 0.26, a trend smoothing constant (delta) of 0.59, a previous trend amount, seasonally adjusted,...
That is the question. There's no more information I
can give you about it.
The information technology department needs to forecast spending on cyber security. The data for several months is supplied below. Be careful since the data is listed beginning with the most recent. The forecasting method to be used here is exponential smoothing with trend accounting for seasonality given a smoothing constant (alpha) of 0.26, a trend smoothing constant (delta) of 0.59, a previous trend amount, seasonally adjusted,...
Date Gasoline Crude Oil Jan 01, 2010 2.031 79.07 Jan 08, 2010 2.124 82.34 Jan 15,...
 Date Gasoline Crude Oil
Jan 01, 2010 2.031 79.07
Jan 08, 2010 2.124 82.34
Jan 15, 2010 2.079 80.06
Jan 22, 2010 2.010 76.62
Jan 29, 2010 1.942 73.94
Feb 05, 2010 1.885 74.57
Feb 12, 2010 1.908 73.88
Feb 19, 2010 2.031 78.25
Feb 26, 2010 2.042 79.22
Mar 05, 2010 2.127 80.19
Mar 12, 2010 2.154 81.76
Mar 19, 2010 2.150 81.44
Mar 26, 2010 2.118 80.65
Apr 02, 2010 2.191 83.01
Apr 09, 2010 2.238 85.66
Apr...
Date Gasoline Crude Oil
Jan 01, 2010 2.031 79.07
Jan 08, 2010 2.124 82.34
Jan 15, 2010 2.079 80.06
Jan 22, 2010 2.010 76.62
Jan 29, 2010 1.942 73.94
Feb 05, 2010 1.885 74.57
Feb 12, 2010 1.908 73.88
Feb 19, 2010 2.031 78.25
Feb 26, 2010 2.042 79.22
Mar 05, 2010 2.127 80.19
Mar 12, 2010 2.154 81.76
Mar 19, 2010 2.150 81.44
Mar 26, 2010 2.118 80.65
Apr 02, 2010 2.191 83.01
Apr 09, 2010 2.238 85.66
Apr...
Given the following data, what is the Mean Absolute Deviation (MAD): Month Demand Forecast Jan 100...
Given the following data, what is the Mean Absolute Deviation (MAD): Month Demand Forecast Jan 100 110 Feb 100 100 Mar 120 100 Apr 110 90 May 100 110 Jun 90 100 Jul 80 90 Aug 90 80 Sep 100 110 Oct 110 100 Nov 110 110 Dec 120 110 A. 10 B. 20 C. 30 D. 133.33
Energy Healthcare May-11 Sep-11 Oct-11 Jun-12 Sep-12 Oct-12 Nov-12 Dec-12 Mar-13 May-13 Oct-13 De...
 Energy Healthcare May-11 Sep-11 Oct-11 Jun-12 Sep-12 Oct-12 Nov-12 Dec-12 Mar-13 May-13 Oct-13 Dec-13 6 Mar-14 un-14 Jul-14 14 ep-14 ct-14 4.67 9.05 8.57 Feb-15 5.02 4.8 Apr-15 0.58 7.79 Aug-15 4.83 5.81 Dec-15 11.81 1.5 8.84 1.8 12.42 Apr-16 May-16 2.62 2.75 0.04 5.2 4.95 0.59 7.67 Jul-16 Aug-16 Dec-16 0.2 5.23 The following table shows a portion of the monthly returns data (in percent) for 2010-2016 for two of Vanguard's mutual funds: the Vanguard Energy Fund and the...
Physical Geography Laboratory Manal Annual: 21 C (70 F); 161.8 cm (63.6" 3. New Orleans, Louisiana (30 N, 90 w FEB MAR JAN 3.7 14.7em 9.4 m 10.2 om11.9 4.0 46 u. Caroline Islands (SN, 137E) A...
 Physical Geography Laboratory Manal Annual: 21 C (70 F); 161.8 cm (63.6" 3. New Orleans, Louisiana (30 N, 90 w FEB MAR JAN 3.7 14.7em 9.4 m 10.2 om11.9 4.0 46 u. Caroline Islands (SN, 137E) Average Annual: 27-C (51℉: 3962 cmus JAN FEB | MARI APR | MAY | JUN | JUL | AUG | SEP | (OT 14.8" l i1.8-1127 m) 30,0 сн" | 32.3 cm | 19.9. | .14.0. |15.7- 50.5 crn | 35.6 cm | |...
Energy Healthcare May-11 Sep-11 Oct-11 Jun-12 Sep-12 Oct-12 Nov-12 Dec-12 Mar-13 May-13 Oct-13 Dec-13 6 Mar-14...
 Energy Healthcare May-11 Sep-11 Oct-11 Jun-12 Sep-12 Oct-12 Nov-12 Dec-12 Mar-13 May-13 Oct-13 Dec-13 6 Mar-14 un-14 Jul-14 14 ep-14 ct-14 4.67 9.05 8.57 Feb-15 5.02 4.8 Apr-15 0.58 7.79 Aug-15 4.83 5.81 Dec-15 11.81 1.5 8.84 1.8 12.42 Apr-16 May-16 2.62 2.75 0.04 5.2 4.95 0.59 7.67 Jul-16 Aug-16 Dec-16 0.2 5.23 The following table shows a portion of the monthly returns data (in percent) for 2010-2016 for two of Vanguard's mutual funds: the Vanguard Energy Fund and the...
On Blackboard under "Course Content / Homeworks and Practice Tests" there is an Excel file titled...
 On Blackboard under "Course Content / Homeworks and Practice Tests" there is an Excel file titled "HW 6 Data" with monthly stock return data to be used for this question: What is Deckers Outdoor Corporation's [DECK] beta? Round to two decimal places. [Hint: Take S&P 500 as a proxy for the market, and use the beta formula from the book. You will need to use two Excel functions: STDEV.S and CORREL] Numeric Answer S&PS00 DECK NKE SBUX -1.5% Ос-19 7.4%...
integrated mini-case: Disney’s Beta When you go on the web to find a firm’s beta, you...
 integrated mini-case: Disney’s Beta
When you go on the web to find a firm’s beta, you do not know
how recently it was computed, what index was used as a proxy for
the market portfolio, or which time series of returns the
calculations used. Earlier in this chapter, it was shown that when
we went on the Web to find a beta for Disney, we found the
following: MSN Money (1.29) and Yahoo! Finance (1.18). An
alternative is to compute...
integrated mini-case: Disney’s Beta
When you go on the web to find a firm’s beta, you do not know
how recently it was computed, what index was used as a proxy for
the market portfolio, or which time series of returns the
calculations used. Earlier in this chapter, it was shown that when
we went on the Web to find a beta for Disney, we found the
following: MSN Money (1.29) and Yahoo! Finance (1.18). An
alternative is to compute...
help with all please. our: Labs 9, 11, andec 03, Wed, 8ay has dry.warm to hot summers and mild, somewhat 16. Which of the following mid-latitude climates has rainy winters? a. Tropical Savanna. b....
 help with all please.
our: Labs 9, 11, andec 03, Wed, 8ay has dry.warm to hot summers and mild, somewhat 16. Which of the following mid-latitude climates has rainy winters? a. Tropical Savanna. b. Humid Continental c. Mediterranean. d. Tropical Monsoon. e. Subarctic (Boreal Forest 17. Within the Kö a lower-case 'w' indicates a. a steppe (semi-arid) climate; wet winter season lwilt e ate Clesilicalion ystom, anupper cone W idcale b. a tundra climate; warm winter season a cool-summer climate;...
help with all please.
our: Labs 9, 11, andec 03, Wed, 8ay has dry.warm to hot summers and mild, somewhat 16. Which of the following mid-latitude climates has rainy winters? a. Tropical Savanna. b. Humid Continental c. Mediterranean. d. Tropical Monsoon. e. Subarctic (Boreal Forest 17. Within the Kö a lower-case 'w' indicates a. a steppe (semi-arid) climate; wet winter season lwilt e ate Clesilicalion ystom, anupper cone W idcale b. a tundra climate; warm winter season a cool-summer climate;...
 The human resources department needs to forecast the number of employees at a site. The data for several months is supplied below. Be careful since the data is listed beginning with the most recent. The forecasting method to be used here is the 7 month moving average. Please round your forecast to the nearest whole number Nov 2019: 956 Oct 2019: 1014 Sep 2019: 1009 Aug 2019: 963 Jul 2019: 966 Jun 2019: 1024 May 2019: 1045||Apr 2019: 1047 Mar...
 That is the question. There's no more information I
can give you about it.
The information technology department needs to forecast spending on cyber security. The data for several months is supplied below. Be careful since the data is listed beginning with the most recent. The forecasting method to be used here is exponential smoothing with trend accounting for seasonality given a smoothing constant (alpha) of 0.26, a trend smoothing constant (delta) of 0.59, a previous trend amount, seasonally adjusted,...
That is the question. There's no more information I
can give you about it.
The information technology department needs to forecast spending on cyber security. The data for several months is supplied below. Be careful since the data is listed beginning with the most recent. The forecasting method to be used here is exponential smoothing with trend accounting for seasonality given a smoothing constant (alpha) of 0.26, a trend smoothing constant (delta) of 0.59, a previous trend amount, seasonally adjusted,...
 Date Gasoline Crude Oil
Jan 01, 2010 2.031 79.07
Jan 08, 2010 2.124 82.34
Jan 15, 2010 2.079 80.06
Jan 22, 2010 2.010 76.62
Jan 29, 2010 1.942 73.94
Feb 05, 2010 1.885 74.57
Feb 12, 2010 1.908 73.88
Feb 19, 2010 2.031 78.25
Feb 26, 2010 2.042 79.22
Mar 05, 2010 2.127 80.19
Mar 12, 2010 2.154 81.76
Mar 19, 2010 2.150 81.44
Mar 26, 2010 2.118 80.65
Apr 02, 2010 2.191 83.01
Apr 09, 2010 2.238 85.66
Apr...
Date Gasoline Crude Oil
Jan 01, 2010 2.031 79.07
Jan 08, 2010 2.124 82.34
Jan 15, 2010 2.079 80.06
Jan 22, 2010 2.010 76.62
Jan 29, 2010 1.942 73.94
Feb 05, 2010 1.885 74.57
Feb 12, 2010 1.908 73.88
Feb 19, 2010 2.031 78.25
Feb 26, 2010 2.042 79.22
Mar 05, 2010 2.127 80.19
Mar 12, 2010 2.154 81.76
Mar 19, 2010 2.150 81.44
Mar 26, 2010 2.118 80.65
Apr 02, 2010 2.191 83.01
Apr 09, 2010 2.238 85.66
Apr...
 Energy Healthcare May-11 Sep-11 Oct-11 Jun-12 Sep-12 Oct-12 Nov-12 Dec-12 Mar-13 May-13 Oct-13 Dec-13 6 Mar-14 un-14 Jul-14 14 ep-14 ct-14 4.67 9.05 8.57 Feb-15 5.02 4.8 Apr-15 0.58 7.79 Aug-15 4.83 5.81 Dec-15 11.81 1.5 8.84 1.8 12.42 Apr-16 May-16 2.62 2.75 0.04 5.2 4.95 0.59 7.67 Jul-16 Aug-16 Dec-16 0.2 5.23 The following table shows a portion of the monthly returns data (in percent) for 2010-2016 for two of Vanguard's mutual funds: the Vanguard Energy Fund and the...
 Physical Geography Laboratory Manal Annual: 21 C (70 F); 161.8 cm (63.6" 3. New Orleans, Louisiana (30 N, 90 w FEB MAR JAN 3.7 14.7em 9.4 m 10.2 om11.9 4.0 46 u. Caroline Islands (SN, 137E) Average Annual: 27-C (51℉: 3962 cmus JAN FEB | MARI APR | MAY | JUN | JUL | AUG | SEP | (OT 14.8" l i1.8-1127 m) 30,0 сн" | 32.3 cm | 19.9. | .14.0. |15.7- 50.5 crn | 35.6 cm | |...
 Energy Healthcare May-11 Sep-11 Oct-11 Jun-12 Sep-12 Oct-12 Nov-12 Dec-12 Mar-13 May-13 Oct-13 Dec-13 6 Mar-14 un-14 Jul-14 14 ep-14 ct-14 4.67 9.05 8.57 Feb-15 5.02 4.8 Apr-15 0.58 7.79 Aug-15 4.83 5.81 Dec-15 11.81 1.5 8.84 1.8 12.42 Apr-16 May-16 2.62 2.75 0.04 5.2 4.95 0.59 7.67 Jul-16 Aug-16 Dec-16 0.2 5.23 The following table shows a portion of the monthly returns data (in percent) for 2010-2016 for two of Vanguard's mutual funds: the Vanguard Energy Fund and the...
 On Blackboard under "Course Content / Homeworks and Practice Tests" there is an Excel file titled "HW 6 Data" with monthly stock return data to be used for this question: What is Deckers Outdoor Corporation's [DECK] beta? Round to two decimal places. [Hint: Take S&P 500 as a proxy for the market, and use the beta formula from the book. You will need to use two Excel functions: STDEV.S and CORREL] Numeric Answer S&PS00 DECK NKE SBUX -1.5% Ос-19 7.4%...
 integrated mini-case: Disney’s Beta
When you go on the web to find a firm’s beta, you do not know
how recently it was computed, what index was used as a proxy for
the market portfolio, or which time series of returns the
calculations used. Earlier in this chapter, it was shown that when
we went on the Web to find a beta for Disney, we found the
following: MSN Money (1.29) and Yahoo! Finance (1.18). An
alternative is to compute...
integrated mini-case: Disney’s Beta
When you go on the web to find a firm’s beta, you do not know
how recently it was computed, what index was used as a proxy for
the market portfolio, or which time series of returns the
calculations used. Earlier in this chapter, it was shown that when
we went on the Web to find a beta for Disney, we found the
following: MSN Money (1.29) and Yahoo! Finance (1.18). An
alternative is to compute...
 help with all please.
our: Labs 9, 11, andec 03, Wed, 8ay has dry.warm to hot summers and mild, somewhat 16. Which of the following mid-latitude climates has rainy winters? a. Tropical Savanna. b. Humid Continental c. Mediterranean. d. Tropical Monsoon. e. Subarctic (Boreal Forest 17. Within the Kö a lower-case 'w' indicates a. a steppe (semi-arid) climate; wet winter season lwilt e ate Clesilicalion ystom, anupper cone W idcale b. a tundra climate; warm winter season a cool-summer climate;...
help with all please.
our: Labs 9, 11, andec 03, Wed, 8ay has dry.warm to hot summers and mild, somewhat 16. Which of the following mid-latitude climates has rainy winters? a. Tropical Savanna. b. Humid Continental c. Mediterranean. d. Tropical Monsoon. e. Subarctic (Boreal Forest 17. Within the Kö a lower-case 'w' indicates a. a steppe (semi-arid) climate; wet winter season lwilt e ate Clesilicalion ystom, anupper cone W idcale b. a tundra climate; warm winter season a cool-summer climate;...
Most questions answered within 3 hours.
-
Facebook Marketing benefit: How is this tool useful for
marketing purposes? Identify and explain at least...
asked 10 minutes ago -
What are the five considerations relevant to the
substantive fairness of a dismissal for permanent incapacity?...
asked 10 minutes ago -
Prince Electronics, a manufacturer of consumer electronic
goods, has five distribution centers in different regions of...
asked 12 minutes ago -
1.) For the following general reaction, rate = k[A]2 and k = 1.3
× 10−2 M−1...
asked 15 minutes ago -
In the Enron documentary(Netflix) What ethical issues did you
observe and who was responsible for them?
asked 16 minutes ago -
Many products fail, some of them spectacularly. Why do you
believe the failure rate for new...
asked 15 minutes ago -
An important news announcement is transmitted by radio waves to
people who are 65 km away,...
asked 34 minutes ago -
On June 30, 2021, Rosetta Granite purchased equipment for
$130,000. The estimated useful life of the...
asked 34 minutes ago -
. If you were the CEO of Agricole, would you pursue an
acquisition target in the...
asked 34 minutes ago -
(a) We define standard Gibbs energy change, G0 =
H0 – TS0, what is the relationship...
asked 34 minutes ago -
If the barometric pressure is 107.4 kPa, what is the pressure in
kPa of the gas...
asked 55 minutes ago -
A resonance tube can be used to measure the speed of sound in
air. A tuning...
asked 49 minutes ago