
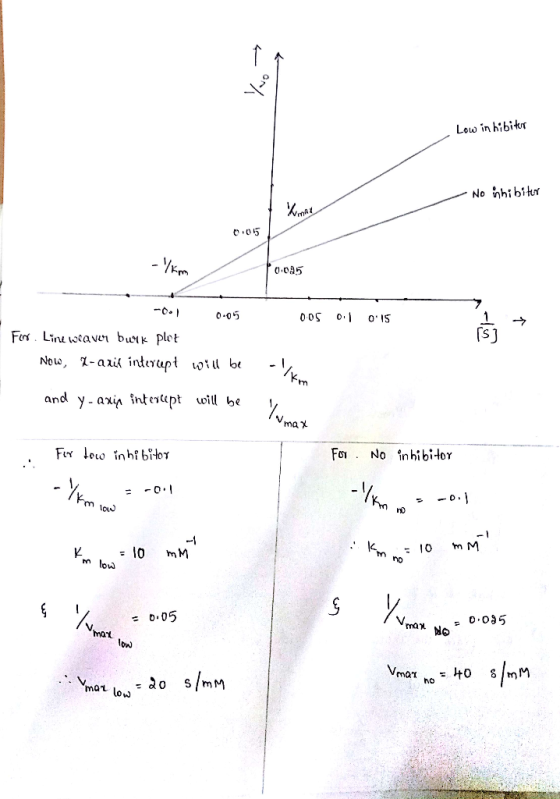
Please show how to calculate Km and Vmax for no inhibitor/low inhibitor given graph. Show how to solve for a.,a/a etc.
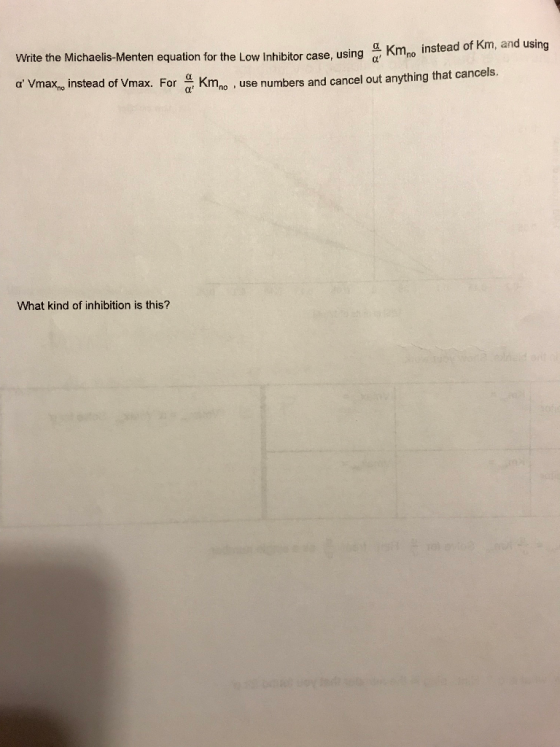
Write the Michaelis-Menten equation for the Low inhibitor case, using α; Kmno n Write the Michaelis-Menten equation for the Low Inhibitor case, using . Kmno inste ad of Km, and using or a' Kmno use numbers and cancel out anything that cancels What kind of inhibition is this?
Homework Answers

Add Answer to:
Please show how to calculate Km and Vmax for no inhibitor/low inhibitor given graph. Show how to ...
How can the Michaelis-Menten constant, be derived from this Lineweaver-Burk plot? Vmax O km = (-1)/(x-intercept)...
 How can the Michaelis-Menten constant, be derived from this Lineweaver-Burk plot? Vmax O km = (-1)/(x-intercept) O km = (-1) * (x-intercept) O km = 1/(x-intercept) 0 Km = s;lope
a. what are the values of Vmax and Km in the abscence if the inhibitor what...
 a. what are the values of Vmax and Km in the abscence if the
inhibitor what are the values of Vmax and Km in the presence of the
inhibitor?
b. what type of inhibition is it?
c. what is the dissociation constant (Ki) of the
inhibition?
***d. graph a linear scatter plot including equation.
Homework (CHE 407) The initial velocity for an enzyme-catalyzed reaction is measured at various initial substrate concentration [S]o, in the absence and in the presence of...
a. what are the values of Vmax and Km in the abscence if the
inhibitor what are the values of Vmax and Km in the presence of the
inhibitor?
b. what type of inhibition is it?
c. what is the dissociation constant (Ki) of the
inhibition?
***d. graph a linear scatter plot including equation.
Homework (CHE 407) The initial velocity for an enzyme-catalyzed reaction is measured at various initial substrate concentration [S]o, in the absence and in the presence of...
12. From the Lineweaver-Burk graph given: a. What are the Km and Vmax for the uninhibited...
 12. From the Lineweaver-Burk graph given: a. What are the Km and Vmax for the uninhibited case? b. What type of inhibition is occurring? c. Shown on the page after the Lineweaver-Burk plot are semi-qualitative sketches for three V vs. (S) plots. Which one of these most likely corresponds to this particular experiment (A,B or C)? Scani explain th Cant catimer IIIIIIIII IIIIIIIII - -- | - | IIIII We were unable to transcribe this image
please graph all 3 lines and explain the vmax&km How to: Lineweaver Burke 1. The following...
 please graph all 3 lines and explain the
vmax&km
How to: Lineweaver Burke 1. The following data was determined for an enzyme in the absence of an inhibitor and in the presence of two different inhibitors (V2 and V3). Determine the V. and K for the enzyme (1) Plot the data and determine the type of inhibition for each inhibitor (S) mm 1 V2 4.3 5.5 V1 12 20 29 2 relliate 150b
please graph all 3 lines and explain the
vmax&km
How to: Lineweaver Burke 1. The following data was determined for an enzyme in the absence of an inhibitor and in the presence of two different inhibitors (V2 and V3). Determine the V. and K for the enzyme (1) Plot the data and determine the type of inhibition for each inhibitor (S) mm 1 V2 4.3 5.5 V1 12 20 29 2 relliate 150b
Nobody has been able to solve the Km. The Vmax values are correct. I believe I...
 Nobody has been able to solve the Km. The Vmax values are
correct. I believe I have my graph wrong. Can someone please help
me solve this.
Using the Lineweaver-Burk Equation 1/Vo Km/Vmax[S]1/Vmax) create a graph of both the Non-Inhibited data and Inhibited data below (on the same graph axes) and calculate the KM and VMax for each line. Vo (umol/L.min) Vo (Hmol/L-min) [Sol (umol/L) Non-Inhibited Data Inhibited Data .00e-06 13.9 7.60 .00e-06 18.0 9.90 ..10e- 05 10e-05 26.0 14.8...
Nobody has been able to solve the Km. The Vmax values are
correct. I believe I have my graph wrong. Can someone please help
me solve this.
Using the Lineweaver-Burk Equation 1/Vo Km/Vmax[S]1/Vmax) create a graph of both the Non-Inhibited data and Inhibited data below (on the same graph axes) and calculate the KM and VMax for each line. Vo (umol/L.min) Vo (Hmol/L-min) [Sol (umol/L) Non-Inhibited Data Inhibited Data .00e-06 13.9 7.60 .00e-06 18.0 9.90 ..10e- 05 10e-05 26.0 14.8...
show work please! with inhibitor (umoles/min/mg) [S] (mm) v- no inhibitor (umoles/min/mg) V - with inhibitor...
 show work please!
with inhibitor (umoles/min/mg) [S] (mm) v- no inhibitor (umoles/min/mg) V - with inhibitor (umoles 3.0 2.29 x 10³ 1.83 x 10³ 5.0 or ble 3.20 x 10³ Boristeder s obre o 2.56 x 10³ 7.0 3.86 x 10³ USD 3.09 x 10³ 0 9. 4 .36 x 100W 3.49 x 10³ 0 11. 4 .75 x 108 3.80 x 10³ Draw Lineweaver-Burk plots for the enzyme data shown above. When present, I = 0.200 m a) What...
show work please!
with inhibitor (umoles/min/mg) [S] (mm) v- no inhibitor (umoles/min/mg) V - with inhibitor (umoles 3.0 2.29 x 10³ 1.83 x 10³ 5.0 or ble 3.20 x 10³ Boristeder s obre o 2.56 x 10³ 7.0 3.86 x 10³ USD 3.09 x 10³ 0 9. 4 .36 x 100W 3.49 x 10³ 0 11. 4 .75 x 108 3.80 x 10³ Draw Lineweaver-Burk plots for the enzyme data shown above. When present, I = 0.200 m a) What...
how we can solve q2 2. a) The Michaelis-Menten mechanism is +KTERE] - @s→Es (rateco nstant...
 how we can solve q2
2. a) The Michaelis-Menten mechanism is +KTERE] - @s→Es (rateco nstant kl) ク ES→ E + S (rate constant k2) E S ES-XⓟHE) orate constant k3) So d[PVdt- k3[ES] Use the steady state approximation to show [El/[ES] (k2+k3)/(k1[S] b) let Km=(k2+k3)/kl and show that you get the expression ·J [EVIES]-Km/[S] c) We will talk in class about how this information eventually gives rise the expression d[P]/dt-k3E][S/(Km +IS) Usually [S>>Km. Show what this equation simplifies to...
how we can solve q2
2. a) The Michaelis-Menten mechanism is +KTERE] - @s→Es (rateco nstant kl) ク ES→ E + S (rate constant k2) E S ES-XⓟHE) orate constant k3) So d[PVdt- k3[ES] Use the steady state approximation to show [El/[ES] (k2+k3)/(k1[S] b) let Km=(k2+k3)/kl and show that you get the expression ·J [EVIES]-Km/[S] c) We will talk in class about how this information eventually gives rise the expression d[P]/dt-k3E][S/(Km +IS) Usually [S>>Km. Show what this equation simplifies to...
2.) a. Given the following equation and using the Lineweaver-Burk equation find the Vmax and Km...
 2.) a. Given the following equation and using the Lineweaver-Burk equation find the Vmax and Km O y=7x+2.5 for enzyme A (in mM and s). b. Suppose you want to compare similar enzymes A (above Kcat=500) with enzyme B (Km=2.0, Kcat=450) to find out which enzyme has a higher catalytic efficiency; which enzyme has the higher catalytic efficiency?
Please show work and answer. my professor gave this hint to us to solve the problem....
 Please show work and answer.
my professor gave this hint to us to solve the problem.
He also said that I could find the relationship between S and
Km and substitute that into the Michaelis-Menten equation.
6. The Km of RBC GLUT1 for glucose is 18 mg/dL while the Km for liver GLUT2 is 360 mg/dL. At a blood glucose concentration of 60 mg/dL, GLUT1 and GLUT2 are working at what percentage of their Vmax? A. GLUT1 at 75% Vmax...
Please show work and answer.
my professor gave this hint to us to solve the problem.
He also said that I could find the relationship between S and
Km and substitute that into the Michaelis-Menten equation.
6. The Km of RBC GLUT1 for glucose is 18 mg/dL while the Km for liver GLUT2 is 360 mg/dL. At a blood glucose concentration of 60 mg/dL, GLUT1 and GLUT2 are working at what percentage of their Vmax? A. GLUT1 at 75% Vmax...
ssessable tutorial que 03/2018 The conversion of corn starch to dextrose using the enzyme glucoamylase was...
 ssessable tutorial que 03/2018 The conversion of corn starch to dextrose using the enzyme glucoamylase was studied in a batch reactor at 60°C. The initial concentration of corn starch was 25 gl. The dosage of glucoamylase, Eo, was 11.6 mgL-. Figure 1, below, shows a Lineweaver-Burk plot for results obtained for the starch to dextrose enzymatic process. 0.13 0.12 0.11 0.10 Slope of plot 1.1 hr y-intercept of plot-0.033 hr L/g 0.09 0.08 0.07 0.04 0.05 0.06 0.07 0.08 0.09...
 How can the Michaelis-Menten constant, be derived from this Lineweaver-Burk plot? Vmax O km = (-1)/(x-intercept) O km = (-1) * (x-intercept) O km = 1/(x-intercept) 0 Km = s;lope
 a. what are the values of Vmax and Km in the abscence if the
inhibitor what are the values of Vmax and Km in the presence of the
inhibitor?
b. what type of inhibition is it?
c. what is the dissociation constant (Ki) of the
inhibition?
***d. graph a linear scatter plot including equation.
Homework (CHE 407) The initial velocity for an enzyme-catalyzed reaction is measured at various initial substrate concentration [S]o, in the absence and in the presence of...
a. what are the values of Vmax and Km in the abscence if the
inhibitor what are the values of Vmax and Km in the presence of the
inhibitor?
b. what type of inhibition is it?
c. what is the dissociation constant (Ki) of the
inhibition?
***d. graph a linear scatter plot including equation.
Homework (CHE 407) The initial velocity for an enzyme-catalyzed reaction is measured at various initial substrate concentration [S]o, in the absence and in the presence of...
 12. From the Lineweaver-Burk graph given: a. What are the Km and Vmax for the uninhibited case? b. What type of inhibition is occurring? c. Shown on the page after the Lineweaver-Burk plot are semi-qualitative sketches for three V vs. (S) plots. Which one of these most likely corresponds to this particular experiment (A,B or C)? Scani explain th Cant catimer IIIIIIIII IIIIIIIII - -- | - | IIIII We were unable to transcribe this image
 please graph all 3 lines and explain the
vmax&km
How to: Lineweaver Burke 1. The following data was determined for an enzyme in the absence of an inhibitor and in the presence of two different inhibitors (V2 and V3). Determine the V. and K for the enzyme (1) Plot the data and determine the type of inhibition for each inhibitor (S) mm 1 V2 4.3 5.5 V1 12 20 29 2 relliate 150b
please graph all 3 lines and explain the
vmax&km
How to: Lineweaver Burke 1. The following data was determined for an enzyme in the absence of an inhibitor and in the presence of two different inhibitors (V2 and V3). Determine the V. and K for the enzyme (1) Plot the data and determine the type of inhibition for each inhibitor (S) mm 1 V2 4.3 5.5 V1 12 20 29 2 relliate 150b
 Nobody has been able to solve the Km. The Vmax values are
correct. I believe I have my graph wrong. Can someone please help
me solve this.
Using the Lineweaver-Burk Equation 1/Vo Km/Vmax[S]1/Vmax) create a graph of both the Non-Inhibited data and Inhibited data below (on the same graph axes) and calculate the KM and VMax for each line. Vo (umol/L.min) Vo (Hmol/L-min) [Sol (umol/L) Non-Inhibited Data Inhibited Data .00e-06 13.9 7.60 .00e-06 18.0 9.90 ..10e- 05 10e-05 26.0 14.8...
Nobody has been able to solve the Km. The Vmax values are
correct. I believe I have my graph wrong. Can someone please help
me solve this.
Using the Lineweaver-Burk Equation 1/Vo Km/Vmax[S]1/Vmax) create a graph of both the Non-Inhibited data and Inhibited data below (on the same graph axes) and calculate the KM and VMax for each line. Vo (umol/L.min) Vo (Hmol/L-min) [Sol (umol/L) Non-Inhibited Data Inhibited Data .00e-06 13.9 7.60 .00e-06 18.0 9.90 ..10e- 05 10e-05 26.0 14.8...
 show work please!
with inhibitor (umoles/min/mg) [S] (mm) v- no inhibitor (umoles/min/mg) V - with inhibitor (umoles 3.0 2.29 x 10³ 1.83 x 10³ 5.0 or ble 3.20 x 10³ Boristeder s obre o 2.56 x 10³ 7.0 3.86 x 10³ USD 3.09 x 10³ 0 9. 4 .36 x 100W 3.49 x 10³ 0 11. 4 .75 x 108 3.80 x 10³ Draw Lineweaver-Burk plots for the enzyme data shown above. When present, I = 0.200 m a) What...
show work please!
with inhibitor (umoles/min/mg) [S] (mm) v- no inhibitor (umoles/min/mg) V - with inhibitor (umoles 3.0 2.29 x 10³ 1.83 x 10³ 5.0 or ble 3.20 x 10³ Boristeder s obre o 2.56 x 10³ 7.0 3.86 x 10³ USD 3.09 x 10³ 0 9. 4 .36 x 100W 3.49 x 10³ 0 11. 4 .75 x 108 3.80 x 10³ Draw Lineweaver-Burk plots for the enzyme data shown above. When present, I = 0.200 m a) What...
 how we can solve q2
2. a) The Michaelis-Menten mechanism is +KTERE] - @s→Es (rateco nstant kl) ク ES→ E + S (rate constant k2) E S ES-XⓟHE) orate constant k3) So d[PVdt- k3[ES] Use the steady state approximation to show [El/[ES] (k2+k3)/(k1[S] b) let Km=(k2+k3)/kl and show that you get the expression ·J [EVIES]-Km/[S] c) We will talk in class about how this information eventually gives rise the expression d[P]/dt-k3E][S/(Km +IS) Usually [S>>Km. Show what this equation simplifies to...
how we can solve q2
2. a) The Michaelis-Menten mechanism is +KTERE] - @s→Es (rateco nstant kl) ク ES→ E + S (rate constant k2) E S ES-XⓟHE) orate constant k3) So d[PVdt- k3[ES] Use the steady state approximation to show [El/[ES] (k2+k3)/(k1[S] b) let Km=(k2+k3)/kl and show that you get the expression ·J [EVIES]-Km/[S] c) We will talk in class about how this information eventually gives rise the expression d[P]/dt-k3E][S/(Km +IS) Usually [S>>Km. Show what this equation simplifies to...
 2.) a. Given the following equation and using the Lineweaver-Burk equation find the Vmax and Km O y=7x+2.5 for enzyme A (in mM and s). b. Suppose you want to compare similar enzymes A (above Kcat=500) with enzyme B (Km=2.0, Kcat=450) to find out which enzyme has a higher catalytic efficiency; which enzyme has the higher catalytic efficiency?
 Please show work and answer.
my professor gave this hint to us to solve the problem.
He also said that I could find the relationship between S and
Km and substitute that into the Michaelis-Menten equation.
6. The Km of RBC GLUT1 for glucose is 18 mg/dL while the Km for liver GLUT2 is 360 mg/dL. At a blood glucose concentration of 60 mg/dL, GLUT1 and GLUT2 are working at what percentage of their Vmax? A. GLUT1 at 75% Vmax...
Please show work and answer.
my professor gave this hint to us to solve the problem.
He also said that I could find the relationship between S and
Km and substitute that into the Michaelis-Menten equation.
6. The Km of RBC GLUT1 for glucose is 18 mg/dL while the Km for liver GLUT2 is 360 mg/dL. At a blood glucose concentration of 60 mg/dL, GLUT1 and GLUT2 are working at what percentage of their Vmax? A. GLUT1 at 75% Vmax...
 ssessable tutorial que 03/2018 The conversion of corn starch to dextrose using the enzyme glucoamylase was studied in a batch reactor at 60°C. The initial concentration of corn starch was 25 gl. The dosage of glucoamylase, Eo, was 11.6 mgL-. Figure 1, below, shows a Lineweaver-Burk plot for results obtained for the starch to dextrose enzymatic process. 0.13 0.12 0.11 0.10 Slope of plot 1.1 hr y-intercept of plot-0.033 hr L/g 0.09 0.08 0.07 0.04 0.05 0.06 0.07 0.08 0.09...
Most questions answered within 3 hours.
-
Consider a 1.0 L buffer containing 0.092 mol L-1 HCOOH and 0.100
mol L-1 HCOO-. What...
asked 30 seconds ago -
Koch Realty has owned a vacant land with a FMV of
$775,000 and an adjusted basis...
asked 6 minutes ago -
It is estimated 29% of all adults in United States invest in
stocks and that 85%...
asked 6 minutes ago -
What does a 2-sided p value of 0.04 mean? (I am not asking if it
is...
asked 20 minutes ago -
A parallel-plate capacitor is made from two aluminum-foil
sheets, each 7.8 cmcm wide and 5.1 mmlong....
asked 21 minutes ago -
1. why is toluene a stronger nucleophile than benzene?
2.why is phenol a stronger nucleophile than...
asked 38 minutes ago -
4. How can you solve for the density of the liquid from the
slope? Please show...
asked 38 minutes ago -
when 2053 j of heat is added to 46.3 g of hexane C6H14 the
temperature increases...
asked 1 hour ago -
I need new and unique answers, please. (Use your own words,
don't copy and paste), Please...
asked 1 hour ago -
MCL 445.111 et seq. deals with Home Solicitation Sales.
MCL stands for Michigan Compiled Laws which...
asked 55 minutes ago -
Which of the following items may not create an NOL?
a.
sole proprietorship loss
b.
personal...
asked 1 hour ago -
A hypothetical solution forms between a solid and a liquid. The
values of the thermodynamic quantities...
asked 58 minutes ago