
Homework Answers
What is growth curve?
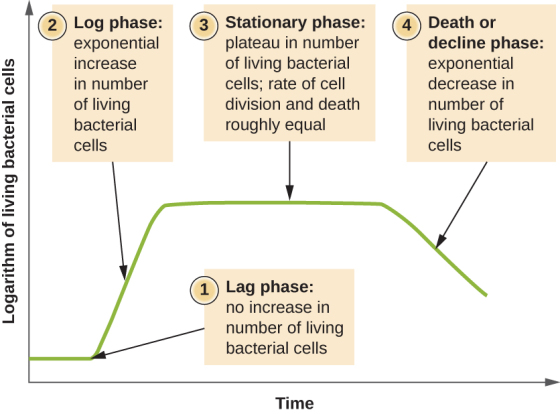
The growth of bacteria has been studied extensively since they are easy to grow in the lab. It has been determined that in a closed system or batch culture (no food added, no wastes removed) bacteria will grow in a predictable pattern, resulting in a growth curve. The phases of growth can be visualized in a graph by plotting time and cell count in the x and y axis. It is composed of four distinct phases of growth: the lag phase, the exponential or log phase, the stationary phase, and the death or decline phase as shown in the graph below.
What is the principle behind the indirect analysis?
The amount of transmitted light through turbid broth decreases with subsequent increase in the absorbance value.

the generation doubling time can be calculated as shown below:

The exactly doubled points from the
absorbance readings were taken and, the points were extrapolated to
meet the respective time axis.
Generation Time = (Time in minutes to obtain the
absorbance 0.4) – (Time in minutes to obtain the absorbance
0.2)
= 90-60
= 30 minutes
Hypothesis0:
Consider, increasing the temperature. Temperature changes affects the growth curve drastically, as shown in the below example. The graph is growth curve of Pseudomonas sp. at different temperatures.

the doubling time is 2.2, 2.5, and 5.5 hours at 4oC, 15oC, and 25oC respectively. We can clearly see the doubling time has increased with increase in the temperature.
Hypothesis1:
When the pressure is increased, also impacts the growth curve.
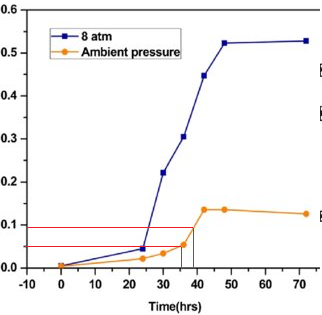
Similar to the previous condition, we can see the lag in the growth phase due to alteration in the optimum pressure conditions.
Add Answer to:
E this experiment follows a modified procedure designed to demonstrate only the lag and log phase...
this is a bacterial growth curve experiment . please explain rhe results Procedure: You will follow...
 this is a bacterial growth curve experiment . please explain
rhe results
Procedure: You will follow the growth of E. coli over the course of the period (3 hrs) by making direct counts of the bacterial suspension by measuring the turbidity of a sample at a given time with a spectrophotometer. The data obtained from the direct counts will be used to plot a partial growth curve. Summary: Turbidity Counts with the Spectrophotometer to measure absorbance at 600. Direct Counts...
this is a bacterial growth curve experiment . please explain
rhe results
Procedure: You will follow the growth of E. coli over the course of the period (3 hrs) by making direct counts of the bacterial suspension by measuring the turbidity of a sample at a given time with a spectrophotometer. The data obtained from the direct counts will be used to plot a partial growth curve. Summary: Turbidity Counts with the Spectrophotometer to measure absorbance at 600. Direct Counts...
Most questions answered within 3 hours.
-
You and your opponent both roll a fair die. If you both roll the
same number,...
asked 6 minutes ago -
In a study of the accuracy of fast food drive-through orders,
Restaurant A had 257 accurate...
asked 6 minutes ago -
Identify and describe in detail the four categories of
institutions that could be included in a...
asked 12 minutes ago -
In python
class Customer:
def __init__(self, customer_id, last_name, first_name, phone_number, address):
self._customer_id = int(customer_id)
self._last_name =...
asked 20 minutes ago -
What is an example of a limitation in implementing a new
ERP system and how it...
asked 15 minutes ago -
In a section of 9.7cm of an artery with a radius of 2.6mm there
is a...
asked 16 minutes ago -
the two carboxylic acid groups of aspartic acid have different
acidities with pKa values of 2.1...
asked 20 minutes ago -
Would CuCO3 aqueous salt combined with calcium chloride
form a solid precipitate? If so, what would...
asked 19 minutes ago -
How do ECM Solutions assist in embedding a culture of continuous
improvement in an organization? (Project...
asked 39 minutes ago -
Directions
These directions introduce the idea of Essential Questions.
Since this may be a new concept...
asked 41 minutes ago -
1.b. Fiscal policy is said to suffer from ‘crowding out’.
Explain what this means and why...
asked 59 minutes ago -
The equation for the reaction of nitrogen and oxygen to form
nitrogen oxide is written as...
asked 1 hour ago