

Homework Answers
When more time will be spent , the turgidity of the solution will be increased as the numbers of the bacteria will also be increased .
And thus the absorbance will also be increased and when this will go to the maximum it means the bacteria has been grown to a saturation level then when you are diluting the sample it is again getting more place and it will then be divided again and similar pattern of ABSORBANCE will be seen.
Add Answer to:
this is a bacterial growth curve experiment . please explain
rhe results
Procedure: You will follow...
please use these results of a growth curve experiment to answer the following questions Questions 1)...
 please use these results of a growth curve experiment to
answer the following questions
Questions 1) Plot the OD600 readings and cell concentration for each time point on a scatterplot with a line connecting the points. Have the measured data (OD600 and cell concentration) on the y-axis against the time on the x-axis using Excel (or other computer based data/graphing program). It is helpful to set the y-axis on a log scale for the cell concentration measurements. 2) Can you...
please use these results of a growth curve experiment to
answer the following questions
Questions 1) Plot the OD600 readings and cell concentration for each time point on a scatterplot with a line connecting the points. Have the measured data (OD600 and cell concentration) on the y-axis against the time on the x-axis using Excel (or other computer based data/graphing program). It is helpful to set the y-axis on a log scale for the cell concentration measurements. 2) Can you...
OBSERVATIONS AND RESULTS 1. Record your results of absorbance values at 600 nm and subsequently plot...
 OBSERVATIONS AND RESULTS 1. Record your results of absorbance values at 600 nm and subsequently plot the cell number versus time in the graph log paper provided on the page 77. Time O min 20 min 40 min 60 min 80 min 100 min 120 min Optical Density 0.008 0.023 0.042 0.073 0.115 0.157 0.206 2. What is the generation time in minutes of E. coli growing under these conditions? Note: generation time must be calculated using Log growth conditions....
3. You are measuring the growth of bacterium using cfu mL·You collect samples at various times an...
 3. You are measuring the growth of bacterium using cfu mL·You collect samples at various times and dilute them in 10-fold series (as shown in the 2 row of the table) and plate 0.1 ml of each of these dilutions on five standard lab agar plates. The average number of colonies per plate are below Time of Colonies on plate at each dilution ars 45 290 TNTC TNTC 195 20 TNTC TNTC 200 TNTC too numerous to count ADB MO...
3. You are measuring the growth of bacterium using cfu mL·You collect samples at various times...
 3. You are measuring the growth of bacterium using cfu mL·You collect samples at various times and dilute them in 10-fold series (as shown in the 2 row of the table) and plate 0.1 ml of each of these dilutions on five standard lab agar plates. The average number of colonies per plate are below Time of Colonies on plate at each dilution ars 45 290 TNTC TNTC 195 20 TNTC TNTC 200 TNTC too numerous to count ADB MO...
Your colleague in the laboratory was able to collect all his raw data from a growth curve on the Hela S3 cell line
 Your colleague in the laboratory was able to collect all his raw data from a growth curve on the Hela S3 cell line, but had to leave unexpectedly and has asked you to perform cell calculations to show your professor. This what your colleague did: he seeded cells into a 24-well plate (allows for replicate sampling and it is much easier to handle one 24-well plate rather than 24 flasks), and on each of the days indicated in the table...
Can someone help me rewrite procedure #3 in paragraph notation. It should be written so that...
 Can someone help me rewrite procedure #3 in paragraph
notation. It should be written so that anyone reading it could
replicate what you did.
1. Place cell growth media in 37degree incubator for at least 30 minutes. 2. Remove tubes containing frozen cells from liquid nitrogen tanks and quickly place the tubes on dry ice. Cells should thaw in about a minute. 3. Once thawed, transfer the cells into a 50ml conical tube and add 50ml of warm growth media...
Can someone help me rewrite procedure #3 in paragraph
notation. It should be written so that anyone reading it could
replicate what you did.
1. Place cell growth media in 37degree incubator for at least 30 minutes. 2. Remove tubes containing frozen cells from liquid nitrogen tanks and quickly place the tubes on dry ice. Cells should thaw in about a minute. 3. Once thawed, transfer the cells into a 50ml conical tube and add 50ml of warm growth media...
2 What is the minimum genotype of a recombinant cell that grew on minimal media supplemented...
 2 What is the minimum genotype of a recombinant cell that grew on minimal media supplemented with arginine, methionine and the antibiotic tetracycline but lacking the essential amino acid isoleucine 3 How would you determine if your recombinant cells had also acquired the tryptophan gene from the Hart Complete the following table indicating which of the organisms (F and/or Hfr used in this experiment would be expected to grow on the given media. Unless specified, MMD is just minimal medium...
lab question 1. What is the basis of the different purification methods? 2. What are some...
lab question 1. What is the basis of the different purification methods? 2. What are some of the factors the might have interfered with your results? 3. How might you improve the process to increase the yield and purity? lab process E. coli BL21 (DE3) cells were transformed with the pET Topo-1521 vector containing a reading frame encoding the green fluorescent protein (GFP). Cells were cultured in M9ZB media at 37°C until the absorbance at 600 nm reached 0.7, at...
please help with ALL questions thank you 1. Using excel, plot your standard curve based on...
 please help with ALL questions thank you
1. Using excel, plot your standard curve based on Table 9-1 and calculate the line of best fit. Put concentration in the x column and OD in the y to solve for the concentrations of your unknown in Table 9-3. Report the slope and the y-intercept below. (1 mark) Slope (m) = v-intercept(b) = 2. Can this standard curve for yeast cells be used for cali cells (why/ why not?) (2 marks) 3....
please help with ALL questions thank you
1. Using excel, plot your standard curve based on Table 9-1 and calculate the line of best fit. Put concentration in the x column and OD in the y to solve for the concentrations of your unknown in Table 9-3. Report the slope and the y-intercept below. (1 mark) Slope (m) = v-intercept(b) = 2. Can this standard curve for yeast cells be used for cali cells (why/ why not?) (2 marks) 3....
Which electrolyte measurement is least affected by hemolysis? a. Calciumb. b- Magnesium c. Potassium d. Total...
Which electrolyte measurement is least affected by hemolysis? a. Calciumb. b- Magnesium c. Potassium d. Total Bilirubin Question 2 of 35 Required Question Which of the following should cause specimen rejection for platelet aggregation studies? a. The sample hematocrit is too high .b. The sample is hemolyzed. c. The sample is over-anticoagulated. d. The sample platelet count is too low. Question 3 of 35 Required Question Which of the following is usually positive in a patient with a urinary tract...
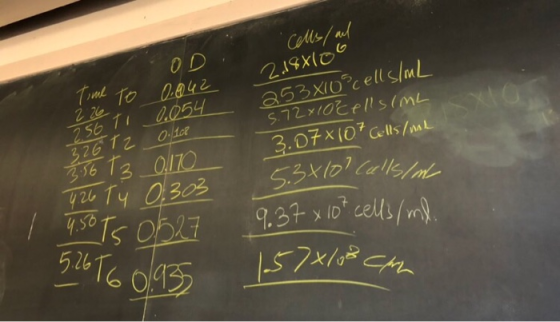
 please use these results of a growth curve experiment to
answer the following questions
Questions 1) Plot the OD600 readings and cell concentration for each time point on a scatterplot with a line connecting the points. Have the measured data (OD600 and cell concentration) on the y-axis against the time on the x-axis using Excel (or other computer based data/graphing program). It is helpful to set the y-axis on a log scale for the cell concentration measurements. 2) Can you...
please use these results of a growth curve experiment to
answer the following questions
Questions 1) Plot the OD600 readings and cell concentration for each time point on a scatterplot with a line connecting the points. Have the measured data (OD600 and cell concentration) on the y-axis against the time on the x-axis using Excel (or other computer based data/graphing program). It is helpful to set the y-axis on a log scale for the cell concentration measurements. 2) Can you...
 OBSERVATIONS AND RESULTS 1. Record your results of absorbance values at 600 nm and subsequently plot the cell number versus time in the graph log paper provided on the page 77. Time O min 20 min 40 min 60 min 80 min 100 min 120 min Optical Density 0.008 0.023 0.042 0.073 0.115 0.157 0.206 2. What is the generation time in minutes of E. coli growing under these conditions? Note: generation time must be calculated using Log growth conditions....
 3. You are measuring the growth of bacterium using cfu mL·You collect samples at various times and dilute them in 10-fold series (as shown in the 2 row of the table) and plate 0.1 ml of each of these dilutions on five standard lab agar plates. The average number of colonies per plate are below Time of Colonies on plate at each dilution ars 45 290 TNTC TNTC 195 20 TNTC TNTC 200 TNTC too numerous to count ADB MO...
 3. You are measuring the growth of bacterium using cfu mL·You collect samples at various times and dilute them in 10-fold series (as shown in the 2 row of the table) and plate 0.1 ml of each of these dilutions on five standard lab agar plates. The average number of colonies per plate are below Time of Colonies on plate at each dilution ars 45 290 TNTC TNTC 195 20 TNTC TNTC 200 TNTC too numerous to count ADB MO...
 Can someone help me rewrite procedure #3 in paragraph
notation. It should be written so that anyone reading it could
replicate what you did.
1. Place cell growth media in 37degree incubator for at least 30 minutes. 2. Remove tubes containing frozen cells from liquid nitrogen tanks and quickly place the tubes on dry ice. Cells should thaw in about a minute. 3. Once thawed, transfer the cells into a 50ml conical tube and add 50ml of warm growth media...
Can someone help me rewrite procedure #3 in paragraph
notation. It should be written so that anyone reading it could
replicate what you did.
1. Place cell growth media in 37degree incubator for at least 30 minutes. 2. Remove tubes containing frozen cells from liquid nitrogen tanks and quickly place the tubes on dry ice. Cells should thaw in about a minute. 3. Once thawed, transfer the cells into a 50ml conical tube and add 50ml of warm growth media...
 2 What is the minimum genotype of a recombinant cell that grew on minimal media supplemented with arginine, methionine and the antibiotic tetracycline but lacking the essential amino acid isoleucine 3 How would you determine if your recombinant cells had also acquired the tryptophan gene from the Hart Complete the following table indicating which of the organisms (F and/or Hfr used in this experiment would be expected to grow on the given media. Unless specified, MMD is just minimal medium...
 please help with ALL questions thank you
1. Using excel, plot your standard curve based on Table 9-1 and calculate the line of best fit. Put concentration in the x column and OD in the y to solve for the concentrations of your unknown in Table 9-3. Report the slope and the y-intercept below. (1 mark) Slope (m) = v-intercept(b) = 2. Can this standard curve for yeast cells be used for cali cells (why/ why not?) (2 marks) 3....
please help with ALL questions thank you
1. Using excel, plot your standard curve based on Table 9-1 and calculate the line of best fit. Put concentration in the x column and OD in the y to solve for the concentrations of your unknown in Table 9-3. Report the slope and the y-intercept below. (1 mark) Slope (m) = v-intercept(b) = 2. Can this standard curve for yeast cells be used for cali cells (why/ why not?) (2 marks) 3....
Most questions answered within 3 hours.
-
You have a 825.3 mL sample of 2.754 M HA (Ka =
4.49⋅10−4). Calculate the pH...
asked 50 minutes ago -
The blues made its way into many kinds of music. Eric Clapton,
The Beatles, and Elvis...
asked 2 hours ago -
8. A wave in a string has a wave function given by: y (x, t) =...
asked 1 hour ago -
If you’re standing at the bottom of a hill and asked to evaluate
it while being...
asked 3 hours ago -
1. Which region has taken the lead in the world of
e-waste handling?
a) European Union...
asked 3 hours ago -
A 8.15- g bullet from a 9-mm pistol has a velocity of 366.0 m/s.
It strikes...
asked 5 hours ago -
The outstanding bonds of Alpha Extracts have a yield to maturity
of 7.4 percent and a...
asked 5 hours ago -
The Problem: The Case of the Harmonizing Vacations
Your CEO is exploring partnering with a European...
asked 6 hours ago -
A chemical equation is balanced by adding coefficients in front
of some formulas so that the...
asked 6 hours ago -
From the literature (reference your sources): What are the
lattice parameters of calcite and aragonite? Why...
asked 7 hours ago -
Your system is rejecting the question am asking which is
preceded by a case study. It...
asked 7 hours ago -
3. On January 2, 2000, Larry creates a trust with himself as
trustee. Larry as trustee...
asked 7 hours ago