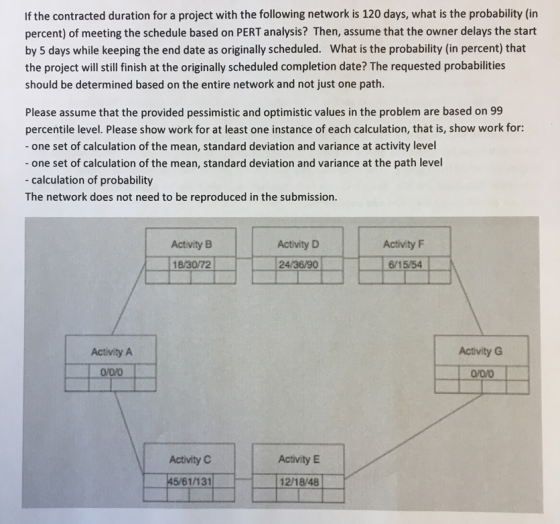
If the contracted duration for a project with the following network is 120 days, what is the probability (in percent) of meeting the schedule based on PERT analysis? Then, assume that the owner delays the start by 5 days while keeping the end date as originally scheduled. What is the probability (in percent) that the project will still finish at the originally scheduled completion date? The requested probabilities should be determined based on the entire network and not just one path.
Please assume that the provided pessimistic and optimistic values in the problem are based on 99 percentile level. Please show work for at least one instance of each calculation, that is, show work for:
- one set of calculation of the mean, standard deviation and variance at activity level
- one set of calculation of the mean, standard deviation and variance at the path level
- calculation of probability
The network does not need to be reproduced in the submission.
Homework Answers


Add Answer to:
If the contracted duration for a project with the following network is 120 days, what is the prob...
5. A project has critical path activities A, B, and C. A is the predecessor of B. B is the predec...
 5. A project has critical path activities A, B, and C. A is the predecessor of B. B is the predecessor of C. The duration estimate for activity A, B and C is shown in the following table. Fill the table with mean duration, standard deviation, and variance for activities and the whole project (critical path). Determine what is the probability of completing this project within 80 days? (10 points) Activity Optimistic Pessimistic Most likely Mean Standard Variance deviation duration...
It was determined on the following project that the duration for the tasks contained some uncertainty....
 It was determined on the following project that the duration for the tasks contained some uncertainty. After more research, the optimistic and pessimistic values were determined. 1. a. Calculate the expected time and variance (using the 95 percent level of confidence) for each activity. b. Determine the critical path and time for completion c. Calculate the probably that the project will finish in 30 days. Calculate the probably of completing the project in 27 days. Other than the critical path,...
1. When finding the approximate probability of project duration, it is necessary to know which of...
1. When finding the approximate probability of project duration, it is necessary to know which of following? a. The mean and variance of each activity b. The mean of each activity on the CP c. The sd of only the activities on the CP d. Each activity's probability of completion e. The distribution of activity times 2. The sd of a path is computed as: a. the sum of the sd of all activities on the path b. the square...
1. State whether each of the following statement is true or false. a) The sequence of...
 1. State whether each of the following statement is true or false. a) The sequence of activities in a project is depicted by the precedence (0.5 mark) (0.5 mark) relationships. The critical path is the shortest path through the project network. Slack is the amount of time an activity can be delayed without delaying the project. In PERT, three time estimates (optimistic, most likely and pessimistic) provide an estimate of the mean and variance for each activity based on the...
2. Given the table below (10 pts): A. Draw the project network B. Calculate the expected...
 2. Given the table below (10 pts): A. Draw the project network B. Calculate the expected time to complete each activity as well as the variance (or standard deviation) associated with that time C. Determine the time associated with each potential path and denote the critical path D. Given the calculated data, what is the probability of completing the project in 30 days? 35 days? E. If you were to try to improve your performance (in terms of time), what...
#1 #2 #3 #4 Time Estimates (in weeks) for SOM's Bus Project is given in the...
 #1
#2
#3
#4
Time Estimates (in weeks) for SOM's Bus Project is given in the following table. Activity Optimistic time Most likely time Pessimistic time A 2 4 6 B 3 5 8 Ic с 4 6 8 D 3 5 10 Please help the project management team to find the standard deviation of Activity D. keep two decimals if not exact, either round up or down is ok. For example, for 0.1346, (0.13 or 13) and (0.14 or.14)...
#1
#2
#3
#4
Time Estimates (in weeks) for SOM's Bus Project is given in the following table. Activity Optimistic time Most likely time Pessimistic time A 2 4 6 B 3 5 8 Ic с 4 6 8 D 3 5 10 Please help the project management team to find the standard deviation of Activity D. keep two decimals if not exact, either round up or down is ok. For example, for 0.1346, (0.13 or 13) and (0.14 or.14)...
Using the following information about Project A, its activities and predecessor activities below: Activity Predecessors A...
 Using the following information about Project A, its activities and predecessor activities below: Activity Predecessors A в B C D E, F D G The following table contains the pessimistic, likely, and optimistic estimates for how long activities are estimated to take for Project A. Activity Pessimistic Likely Optimistic 2 5 20 H 16 e. Calculate the time estimates (TE) f. Calculate the variance (s) g. Convert the TE to whole integers and place them in the network diagram for...
NETWORK: PERT 4 - Consider the following table: ACTIVITY PREC. ACT. TIME ESTIMATES tml - 2...
 NETWORK: PERT 4 - Consider the following table: ACTIVITY PREC. ACT. TIME ESTIMATES tml - 2 (days) tp c D, E 1) Construct a PERT network. [NOTE: This is the most crucial part of the exercise. Make sure you have the correct network before proceeding to the next sections.) 2) By using ES, EF, LF, LS, find the slack of each activity and the critical path. 3) Find the completion time (x) and the standard deviation (6) for the project-...
PERT Analysis: The following represents a project with four activities. All times are in weeks. Activity Immediate Predecessor Optimistic Time Most Likely Time Pessimistic Time A -...
PERT Analysis: The following represents a project with four activities. All times are in weeks. Activity Immediate Predecessor Optimistic Time Most Likely Time Pessimistic Time A - 3 8 14 B - 8 8 8 C A 6 9 18 D B 6 11 17 According to the data in the above Table: What is the critical path? What is the minimum expected completion time for the project? According to the above Table, there are four activities in the project....
Please use the table to answer questions, SHOW WORK Consider the following work breakdown structure for questions 46-50: Duration (Days) Most Start Finish Activity Node Node Optimistic Likely Pessimi...
 Please use the table to answer questions, SHOW WORK
Consider the following work breakdown structure for questions 46-50: Duration (Days) Most Start Finish Activity Node Node Optimistic Likely Pessimistic 50 31 70 41 35 59 34 82 41 58 32 30 5 46 What is the estimated expected (mean) time tor activity D? A 32 days B. 41 days C 44 days D. 42 days E 40 dayts 46 What is the estimated standard deviation for the critical path? A...
Please use the table to answer questions, SHOW WORK
Consider the following work breakdown structure for questions 46-50: Duration (Days) Most Start Finish Activity Node Node Optimistic Likely Pessimistic 50 31 70 41 35 59 34 82 41 58 32 30 5 46 What is the estimated expected (mean) time tor activity D? A 32 days B. 41 days C 44 days D. 42 days E 40 dayts 46 What is the estimated standard deviation for the critical path? A...
 5. A project has critical path activities A, B, and C. A is the predecessor of B. B is the predecessor of C. The duration estimate for activity A, B and C is shown in the following table. Fill the table with mean duration, standard deviation, and variance for activities and the whole project (critical path). Determine what is the probability of completing this project within 80 days? (10 points) Activity Optimistic Pessimistic Most likely Mean Standard Variance deviation duration...
 It was determined on the following project that the duration for the tasks contained some uncertainty. After more research, the optimistic and pessimistic values were determined. 1. a. Calculate the expected time and variance (using the 95 percent level of confidence) for each activity. b. Determine the critical path and time for completion c. Calculate the probably that the project will finish in 30 days. Calculate the probably of completing the project in 27 days. Other than the critical path,...
 1. State whether each of the following statement is true or false. a) The sequence of activities in a project is depicted by the precedence (0.5 mark) (0.5 mark) relationships. The critical path is the shortest path through the project network. Slack is the amount of time an activity can be delayed without delaying the project. In PERT, three time estimates (optimistic, most likely and pessimistic) provide an estimate of the mean and variance for each activity based on the...
 2. Given the table below (10 pts): A. Draw the project network B. Calculate the expected time to complete each activity as well as the variance (or standard deviation) associated with that time C. Determine the time associated with each potential path and denote the critical path D. Given the calculated data, what is the probability of completing the project in 30 days? 35 days? E. If you were to try to improve your performance (in terms of time), what...
 #1
#2
#3
#4
Time Estimates (in weeks) for SOM's Bus Project is given in the following table. Activity Optimistic time Most likely time Pessimistic time A 2 4 6 B 3 5 8 Ic с 4 6 8 D 3 5 10 Please help the project management team to find the standard deviation of Activity D. keep two decimals if not exact, either round up or down is ok. For example, for 0.1346, (0.13 or 13) and (0.14 or.14)...
#1
#2
#3
#4
Time Estimates (in weeks) for SOM's Bus Project is given in the following table. Activity Optimistic time Most likely time Pessimistic time A 2 4 6 B 3 5 8 Ic с 4 6 8 D 3 5 10 Please help the project management team to find the standard deviation of Activity D. keep two decimals if not exact, either round up or down is ok. For example, for 0.1346, (0.13 or 13) and (0.14 or.14)...
 Using the following information about Project A, its activities and predecessor activities below: Activity Predecessors A в B C D E, F D G The following table contains the pessimistic, likely, and optimistic estimates for how long activities are estimated to take for Project A. Activity Pessimistic Likely Optimistic 2 5 20 H 16 e. Calculate the time estimates (TE) f. Calculate the variance (s) g. Convert the TE to whole integers and place them in the network diagram for...
 NETWORK: PERT 4 - Consider the following table: ACTIVITY PREC. ACT. TIME ESTIMATES tml - 2 (days) tp c D, E 1) Construct a PERT network. [NOTE: This is the most crucial part of the exercise. Make sure you have the correct network before proceeding to the next sections.) 2) By using ES, EF, LF, LS, find the slack of each activity and the critical path. 3) Find the completion time (x) and the standard deviation (6) for the project-...
 Please use the table to answer questions, SHOW WORK
Consider the following work breakdown structure for questions 46-50: Duration (Days) Most Start Finish Activity Node Node Optimistic Likely Pessimistic 50 31 70 41 35 59 34 82 41 58 32 30 5 46 What is the estimated expected (mean) time tor activity D? A 32 days B. 41 days C 44 days D. 42 days E 40 dayts 46 What is the estimated standard deviation for the critical path? A...
Please use the table to answer questions, SHOW WORK
Consider the following work breakdown structure for questions 46-50: Duration (Days) Most Start Finish Activity Node Node Optimistic Likely Pessimistic 50 31 70 41 35 59 34 82 41 58 32 30 5 46 What is the estimated expected (mean) time tor activity D? A 32 days B. 41 days C 44 days D. 42 days E 40 dayts 46 What is the estimated standard deviation for the critical path? A...
Most questions answered within 3 hours.
-
An explosion breaks a 20.0-kg object into three parts. The
object is initially moving at a...
asked 45 minutes ago -
Calculate the approximate number of residues of Rubisco, which
is involved in carbon fixation in plants,...
asked 1 hour ago -
Other decisions about scientific claims can have a much broader
impact.ENERGYarrow-10x10.png, environment, health, security - all...
asked 2 hours ago -
I need to write a research paper and work cited about this
topic: The United States...
asked 3 hours ago -
Hello! I was wondering if I could have some help?
If the vapor pressure of carvone...
asked 3 hours ago -
An economist wants to estimate the mean per capita income (in
thousands of dollars) for a...
asked 3 hours ago -
What would be the input/output characteristic of a circuit
obtained by putting two of your 2's-complementers...
asked 3 hours ago -
In Drosophila, the transition from the syncytial blastoderm
stage to the cellular blastoderm stage is a...
asked 4 hours ago -
Project management question:
Name 3 different types of resources (hint: humans are one
type)
asked 4 hours ago -
Consider the following reaction: C 2H 2( g) + 2H 2( g) C 2H 6(
g)...
asked 4 hours ago -
Consider a 1.0 L buffer containing 0.092 mol L-1 HCOOH and 0.100
mol L-1 HCOO-. What...
asked 4 hours ago -
Koch Realty has owned a vacant land with a FMV of
$775,000 and an adjusted basis...
asked 4 hours ago