Please use the table to answer questions, SHOW WORK

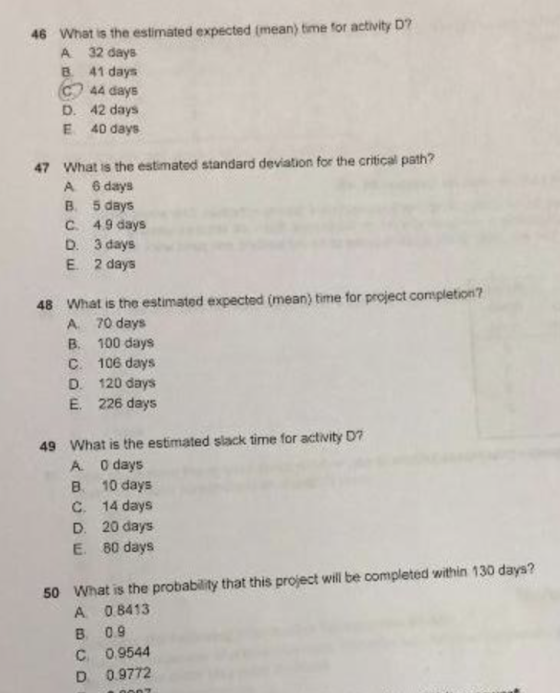
What is the estimated expected (mean) time tor activity D? A 32 days B. 41 days C 44 days D. 42 days E 40 dayts 46 What is the estimated standard deviation for the critical path? A 6 days B. 5 days C. 49 days D. 3 days E. 2 days 47 48 What is the estimated expected (mean) time for project completion? A 70 days B 100 days C 106 days D 120 days E. 226 days What is the estimated slack time for activity D? A 0 days B. 10days C. 14 days D. 20 days E. 80 days 49 What is the probability that this project will be completed within 130 days? A 08413 В 09 C 09544 D 0.9772 50
Homework Answers
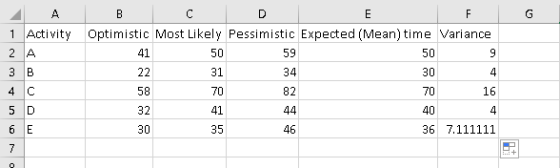
Expected mean time = (Optimistic + pessimistic + 4*most likely)/6
Variance = ((Pessimistic - Optimistic)/6)^2
46.
Correct answer is E.40 days
47.
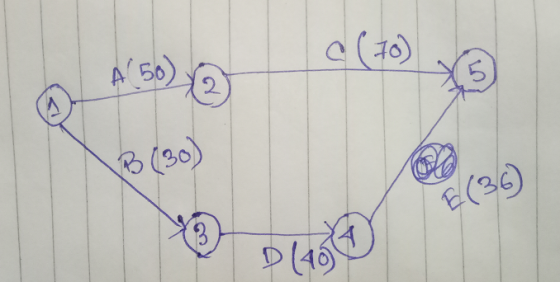
Path available: A-C duration => 120 days
B-D-E duration => 106 days
Critical path is A-C
Variance of critical path = 9+16 = 25 days
Standard deviation of Critical path A-C is sqrt(25) = 5 days
So correct answer is B. 5 days
48.
Estimated time for project completion = Duration of critical path A-C =120 days
Correct answer is D. 120 days
49.
Earliest Start time of B = 0 days
Earliest Finish time of B = Earliest Start time of B + Duration of
B = 0+30 = 30 days
Earliest start time of D = Earliest Finish time of B = 30
days
Earliest Finish time of D = Earliest Start time of D + Duration of
D = 30+40 = 70 days
Late Finish of E = 120 days
Late Start of E = Late Finish of E - Duration of E = 120 - 36 = 84
days
Late Finish of D = Late Start of E = 84 days
Slack of D = Late Finish - Early Finish = 84 - 70 = 14 days
Correct answer is C. 14 days
50.
When x = 130
z = (130 - 120)/5 = 2
Probability of project completing within 130 days = P(Z<2) = 0.9772
So correct answer is D) 0.9772
Add Answer to:
Please use the table to answer questions, SHOW WORK Consider the following work breakdown structure for questions 46-50: Duration (Days) Most Start Finish Activity Node Node Optimistic Likely Pessimi...
TIMES (days) Activity Start Node Finish Node OPTIMISTIC to MOST LIKELY tm PESSIMISTIC tp A 1...
 TIMES (days)
Activity
Start Node
Finish Node
OPTIMISTIC
to
MOST LIKELY
tm
PESSIMISTIC
tp
A
1
2
24
30
42
B
1
3
20
23
32
C
2
5
15
27
39
D
3
4
25
43
61
E
4
5
15
42
69
Given the Activity on Arrow Diagram and the data found in the table
above, calculate each of the following values:
Activity A………te = 31
Standard Deviation = 3
Activity B………te =
Standard Deviation =
Activity C………te...
TIMES (days)
Activity
Start Node
Finish Node
OPTIMISTIC
to
MOST LIKELY
tm
PESSIMISTIC
tp
A
1
2
24
30
42
B
1
3
20
23
32
C
2
5
15
27
39
D
3
4
25
43
61
E
4
5
15
42
69
Given the Activity on Arrow Diagram and the data found in the table
above, calculate each of the following values:
Activity A………te = 31
Standard Deviation = 3
Activity B………te =
Standard Deviation =
Activity C………te...
Activity D on a PERT network has an optimistic duration of 3 days, a most likely...
Activity D on a PERT network has an optimistic duration of 3 days, a most likely duration of 5 days and a pessimistic duration of 13 days. What is the expected duration of activity D? Formula: Expected Activity time: t = (a + 4m + b)/6 a. 5 days b. 6 days c. 7 days d. 10 days e. 12 days
Consider the following precedence chart: ACTIVITY PRECEDING ACTIVITIES OPTIMISTIC TIME (days) PESSIMISTIC TIME days) MOST LIKELY...
 Consider the following precedence chart: ACTIVITY PRECEDING ACTIVITIES OPTIMISTIC TIME (days) PESSIMISTIC TIME days) MOST LIKELY TIME (days) 10 10 10 B.C DE The total slack for activity D is O 2 O O O
Given the following activity list and times in days: (15 points) Activity Optimistic Most Likely Pessimistic...
Given the following activity list and times in days: (15 points) Activity Optimistic Most Likely Pessimistic Time Time Time A 7 10 12 B 6 8 14 C 5 9 12 D 12 14 21 E 10 12 15 F 4 5 8 G 1 3 8 H 12 15 17 NOTE 1: ASSUME THE CRITTCAL PATH IS “B-E-H”. Calculate the schedule duration of the critical path in days. What is the probability of the project being completed...
Use the network activity diagram and table below to answer questions 45-53. Activity Optimistic Most Probable...
 Use the network activity diagram and table below to answer questions 45-53. Activity Optimistic Most Probable Pessimistic A 5 7 B 3 5 7 C 1 2 9 5 E 3 4 2 3 10 G 6 7 14 H 4 12 B G E H. C A. Finish Start F D Using the three time estimate approach, what is the value of uC? O 6 O4 None of the above are correct Use the network activity diagram and table...
Consider the following work breakdown structure: Start Finish Time Estimates(wks) Activity Node Node to tm tp...
Consider the following work breakdown structure: Start Finish Time Estimates(wks) Activity Node Node to tm tp A 1 2 11 20 29 B 2 3 2 5 8 C 2 4 18 30 42 D 3 4 7 10 13 E 1 4 31 40 43 What is the estimated standard deviation in the time for activity E?
Consider the following table of activities. What is the estimated time of the completion of the...
 Consider the following table of activities. What is the estimated time of the completion of the project? Activity Immediate Optimistic Most Likely Predecessor Estimate Estimate A 44 50 B 45 60 A 42 45 D 31 40 E 27 36 F D. E 58 70 (time in days) Pessimistic Estimate 36 75 48 49 39 82 A, B Select one: a. 200 days b. 170 days c. 210 days d. 160 days
tki 4. What is the estimated slack time for activity A? a. O days b. 20...
 tki 4. What is the estimated slack time for activity A? a. O days b. 20 days c. 40 days d. 60 days 5. What is the distribution of assumed project completio a. Normalb. Beta c. Uniform di Binomia shqi - k activity in Belar 6. Write down the critical path: A) START A NE SU Activity Immediate Predecessor Most Likely Estimate Optimistic Estimate 38 90 85 - 가 Pessimistic. Estimate 62 0 50 108 lat 99 100 25 100...
Estimated activity times and precedences are given below: Activity Optimistic Most Likely Pessimistic Required Precedence A...
Estimated activity times and precedences are given below: Activity Optimistic Most Likely Pessimistic Required Precedence A 6 7 14 B 8 10 12 C 2 3 4 D 6 7 8 A E 5 5.5 9 B, C F 5 7 9 B, C G 4 6 8 D, E H 2.7 3 3.5 F What is the probability that the project will be completed within: A. 21 Days B. 22 Days C. 25 Days
QUESTION 1 G E. H. C A Finish Start D. Complete the network activity diagram using the table below to answer questio...
 QUESTION 1 G E. H. C A Finish Start D. Complete the network activity diagram using the table below to answer questions 1-15. The expected activity completion times are provided in days. Each question is 1 point. Most Probable Activity Optimistic Pessimistic A 7 B 12 C 5 12 7 E 10 15 20 6 9 18 G 6 13 H 11 What is the early start (ES) time for activity F? 13 12 10 None of the above are...
 TIMES (days)
Activity
Start Node
Finish Node
OPTIMISTIC
to
MOST LIKELY
tm
PESSIMISTIC
tp
A
1
2
24
30
42
B
1
3
20
23
32
C
2
5
15
27
39
D
3
4
25
43
61
E
4
5
15
42
69
Given the Activity on Arrow Diagram and the data found in the table
above, calculate each of the following values:
Activity A………te = 31
Standard Deviation = 3
Activity B………te =
Standard Deviation =
Activity C………te...
TIMES (days)
Activity
Start Node
Finish Node
OPTIMISTIC
to
MOST LIKELY
tm
PESSIMISTIC
tp
A
1
2
24
30
42
B
1
3
20
23
32
C
2
5
15
27
39
D
3
4
25
43
61
E
4
5
15
42
69
Given the Activity on Arrow Diagram and the data found in the table
above, calculate each of the following values:
Activity A………te = 31
Standard Deviation = 3
Activity B………te =
Standard Deviation =
Activity C………te...
 Consider the following precedence chart: ACTIVITY PRECEDING ACTIVITIES OPTIMISTIC TIME (days) PESSIMISTIC TIME days) MOST LIKELY TIME (days) 10 10 10 B.C DE The total slack for activity D is O 2 O O O
 Use the network activity diagram and table below to answer questions 45-53. Activity Optimistic Most Probable Pessimistic A 5 7 B 3 5 7 C 1 2 9 5 E 3 4 2 3 10 G 6 7 14 H 4 12 B G E H. C A. Finish Start F D Using the three time estimate approach, what is the value of uC? O 6 O4 None of the above are correct Use the network activity diagram and table...
 Consider the following table of activities. What is the estimated time of the completion of the project? Activity Immediate Optimistic Most Likely Predecessor Estimate Estimate A 44 50 B 45 60 A 42 45 D 31 40 E 27 36 F D. E 58 70 (time in days) Pessimistic Estimate 36 75 48 49 39 82 A, B Select one: a. 200 days b. 170 days c. 210 days d. 160 days
 tki 4. What is the estimated slack time for activity A? a. O days b. 20 days c. 40 days d. 60 days 5. What is the distribution of assumed project completio a. Normalb. Beta c. Uniform di Binomia shqi - k activity in Belar 6. Write down the critical path: A) START A NE SU Activity Immediate Predecessor Most Likely Estimate Optimistic Estimate 38 90 85 - 가 Pessimistic. Estimate 62 0 50 108 lat 99 100 25 100...
 QUESTION 1 G E. H. C A Finish Start D. Complete the network activity diagram using the table below to answer questions 1-15. The expected activity completion times are provided in days. Each question is 1 point. Most Probable Activity Optimistic Pessimistic A 7 B 12 C 5 12 7 E 10 15 20 6 9 18 G 6 13 H 11 What is the early start (ES) time for activity F? 13 12 10 None of the above are...
Most questions answered within 3 hours.
-
Casey is on trial under criminal allegations that she engaged in
fraudulent behavior at the company...
asked 9 minutes ago -
1. A boy stands on one end of a boat, and then walks to the
other...
asked 4 minutes ago -
Surplus Styles is a manufacturer of hair care products,
including shampoos, conditioners, and hair gels. The...
asked 8 minutes ago -
Using an income-expenditure diagram, use the infinite line and
double-drop line tools to show the economy...
asked 16 minutes ago -
Which expression computes a pseudorandom integer between -10 and
10 using rand()
from cstdlib?
A. (rand(...
asked 23 minutes ago -
Roybus, Inc., a manufacturer of flash memory, just reported that
its main production facility in Taiwan...
asked 31 minutes ago -
Two capacitors connected in parallel produce an equivalent
capacitance of 45.0 μF but when connected in...
asked 40 minutes ago -
The differences between the two sets of dependent data are -1,
2,-,2, 2. Round to the...
asked 57 minutes ago -
A χ2-curve, looking at the relationship between age and hours
spent working at an office per...
asked 1 hour ago -
The pH of a sample of water from a river is 5.0. A
sample of effluent from...
asked 2 hours ago -
At the beginning of the period, the Fabricating Department
budgeted direct labor of $136,500 and equipment...
asked 2 hours ago -
Please answer all
____ 28. Rent control is usually
justified on the grounds that it protects...
asked 2 hours ago