

(a) Fit the best line - to the points (b) Fit the best line y- mr + c to the points (c) Plot the data points and the best fit lines in (a) and (b). Which of the lines is the better fit?
Homework Answers
Add Answer to:
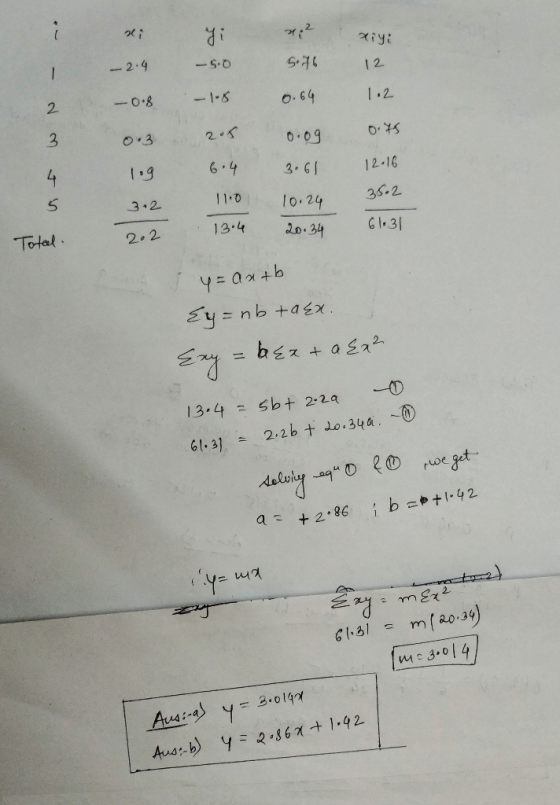
3. Normal equations for n points to fit the line y = mx + c: ri 72 yi Problem 1 The data points i...
1) Consider n data points with 3 covariates and observations {xil, Гіг, xī,3, yi); i-1,.,n, and y...
 1) Consider n data points with 3 covariates and observations {xil, Гіг, xī,3, yi); i-1,.,n, and you fit the following model, y Bo+B+B32+Br+e that is yi-An + ßiXiut Ali,2 + Asri,3 + Ei where є,'s are independent normal distribution with mean zero and variance ơ2 For a observed covariate vector-(1, ri, ^2, r3) (with the intercept and three regressor variables) and observed yg at that point a) write the expression for estimated variance for the fit zs at z. (Let...
2. Suppose Y ~ Exp(a), which has pdf f(y)-1 exp(-y/a). (a) Use the following R code to generate data from the model Yi...
 2. Suppose Y ~ Exp(a), which has pdf f(y)-1 exp(-y/a). (a) Use the following R code to generate data from the model Yi ~ Exp(0.05/Xi), and provide the scatterplot of Y against X set.seed(123) n <- 500 <-rnorm (n, x 3, 1) Y <- rexp(n, X) (b) Fit the model Yi-Ao + Ax, + ε¡ using the lm function in R and provide a plot of the best fit line on the scatterplot of Y vs X, and the residual...
9) Suppose you are given n points: (x,y)(, y). And we wish to fit a cirele to the data. A general...
 9) Suppose you are given n points: (x,y)(, y). And we wish to fit a cirele to the data. A general circle, as we all know, is Cr-y+-k. So the question becomes: What are h, k, and r so that the circle becomes the best least squares fit? Show that this problem becomes Th .e. What is a, B and what is M? B, When fitting the cirele to the data points (0,2), (1,2),3,-),(0,-D,6,0) what are the normal equations? GIVE...
0 3 X Y 2 4 4 Given to the right are two linear equations and...
 0 3 X Y 2 4 4 Given to the right are two linear equations and a set of data points a. Graph the linear equations and data points. b. Complete tables for X. y. y. e, and e? c. Determine which line fits the set of data points better, according to the least squares criterion Line Ay=-1+3x Line : y=1+2x a. Graph the linear equations and data points. Note that Line Ais dashed red and Line B is solid...
PLEASE HELP! 1. Solve for concentration (x) using your best fit line from the graph (y=mx+b) 2....
 PLEASE HELP!
1. Solve for concentration (x) using your best fit
line from the graph (y=mx+b)
2. What is the concentration of your unknown solution in
mM?
3. What is the molar absorptivity (ϵ) of the drink mix? (In
units of mM-1 cm-1)
Table 1: Red 40 Dye Solution [Red 40), M 0.1000 0.0800 0.0500 0.0200 0.0000 Absorbance, AU 0.348 0.295 0.147 0.075 0 Blank Analytical A, nm: Unknown No: Unknown Abs: Slope of B-L Plot: Int'pt of Plot: [Red 40)...
PLEASE HELP!
1. Solve for concentration (x) using your best fit
line from the graph (y=mx+b)
2. What is the concentration of your unknown solution in
mM?
3. What is the molar absorptivity (ϵ) of the drink mix? (In
units of mM-1 cm-1)
Table 1: Red 40 Dye Solution [Red 40), M 0.1000 0.0800 0.0500 0.0200 0.0000 Absorbance, AU 0.348 0.295 0.147 0.075 0 Blank Analytical A, nm: Unknown No: Unknown Abs: Slope of B-L Plot: Int'pt of Plot: [Red 40)...
Given are five observations for two variables, and y. 1 2 3 5 Yi 3 7...
 Given are five observations for two variables, and y. 1 2 3 5 Yi 3 7 5 11 14 The estimated regression equation for these data is ý = 0.2 +2.6z. a. Compute SSE, SST, and SSR using the following equations (to 1 decimal). SSE = Sy.- SST = = (y - SSR = = (y - SSE SST SSR b. Compute the coefficient of determination (to 3 decimals). Does this least squares line provide a good fit? Yes, the...
Consider the following data: x : -7, -5, -1, 0, 2, 5, 6, .y: 15, 12...
Consider the following data: x : -7, -5, -1, 0, 2, 5, 6, .y: 15, 12 ,5, 2, 0, -5, -9. Using linear regression find the equation in the form y=mx+b. b) Check your results for the coefficients in the trial function using a built-in function in Matlab, Python, or Mathematica. c) Plot the data points as dots and the best-fit line as a solid line on the same figure.
(I) Let's start with very simple data table 1.0 2.0 3.0 4.0 5.0 6.0 -1 ±...
 (I) Let's start with very simple data table 1.0 2.0 3.0 4.0 5.0 6.0 -1 ± 1.8 4±2.0 9+ 1.0 14 + 0.8 19 s 0.8 24 + 1.2 2% 1.8 34 ± 2.0 7.0 8.0 9.0 1. Plot a graph of y vs. X on a piece of graph paper 2. Is it a straight line? Draw the best-fit line. 3. Compute the slope and y-intercept for this line. Write the equation for y in terms of x using...
thanks for the help Each of the following two data sets represents a straight line. 1....
 thanks for the help
Each of the following two data sets represents a straight line. 1. Draw a graph (plot the data points and draw the best-fit-straight-line) for each data set (first line vs. second line for each data set). 2. Find the slope of the line-of-best-fit in if plot is linear. 3. Show the calculation of the slope of graph for the corresponding case in the space below 4. Determine the equations of the curve of best fit for...
thanks for the help
Each of the following two data sets represents a straight line. 1. Draw a graph (plot the data points and draw the best-fit-straight-line) for each data set (first line vs. second line for each data set). 2. Find the slope of the line-of-best-fit in if plot is linear. 3. Show the calculation of the slope of graph for the corresponding case in the space below 4. Determine the equations of the curve of best fit for...
Examine the scatter plot. a) Draw a line of best fit through the following data. [1]...
 Examine the scatter plot. a) Draw a line of best fit through the following data. [1] [1] b) Predict a correlation coefficient that would describe this data. c) Describe how the line of best fit would change without the influential point on the right d) The x-axis is amount of snowfall and the y-axis is cars on the road. Make a conclusion about this data, 100 98 96 8 24 2000 = 100 8 85 84 1966 1967 19es 1989...
 1) Consider n data points with 3 covariates and observations {xil, Гіг, xī,3, yi); i-1,.,n, and you fit the following model, y Bo+B+B32+Br+e that is yi-An + ßiXiut Ali,2 + Asri,3 + Ei where є,'s are independent normal distribution with mean zero and variance ơ2 For a observed covariate vector-(1, ri, ^2, r3) (with the intercept and three regressor variables) and observed yg at that point a) write the expression for estimated variance for the fit zs at z. (Let...
 2. Suppose Y ~ Exp(a), which has pdf f(y)-1 exp(-y/a). (a) Use the following R code to generate data from the model Yi ~ Exp(0.05/Xi), and provide the scatterplot of Y against X set.seed(123) n <- 500 <-rnorm (n, x 3, 1) Y <- rexp(n, X) (b) Fit the model Yi-Ao + Ax, + ε¡ using the lm function in R and provide a plot of the best fit line on the scatterplot of Y vs X, and the residual...
 9) Suppose you are given n points: (x,y)(, y). And we wish to fit a cirele to the data. A general circle, as we all know, is Cr-y+-k. So the question becomes: What are h, k, and r so that the circle becomes the best least squares fit? Show that this problem becomes Th .e. What is a, B and what is M? B, When fitting the cirele to the data points (0,2), (1,2),3,-),(0,-D,6,0) what are the normal equations? GIVE...
 0 3 X Y 2 4 4 Given to the right are two linear equations and a set of data points a. Graph the linear equations and data points. b. Complete tables for X. y. y. e, and e? c. Determine which line fits the set of data points better, according to the least squares criterion Line Ay=-1+3x Line : y=1+2x a. Graph the linear equations and data points. Note that Line Ais dashed red and Line B is solid...
 PLEASE HELP!
1. Solve for concentration (x) using your best fit
line from the graph (y=mx+b)
2. What is the concentration of your unknown solution in
mM?
3. What is the molar absorptivity (ϵ) of the drink mix? (In
units of mM-1 cm-1)
Table 1: Red 40 Dye Solution [Red 40), M 0.1000 0.0800 0.0500 0.0200 0.0000 Absorbance, AU 0.348 0.295 0.147 0.075 0 Blank Analytical A, nm: Unknown No: Unknown Abs: Slope of B-L Plot: Int'pt of Plot: [Red 40)...
PLEASE HELP!
1. Solve for concentration (x) using your best fit
line from the graph (y=mx+b)
2. What is the concentration of your unknown solution in
mM?
3. What is the molar absorptivity (ϵ) of the drink mix? (In
units of mM-1 cm-1)
Table 1: Red 40 Dye Solution [Red 40), M 0.1000 0.0800 0.0500 0.0200 0.0000 Absorbance, AU 0.348 0.295 0.147 0.075 0 Blank Analytical A, nm: Unknown No: Unknown Abs: Slope of B-L Plot: Int'pt of Plot: [Red 40)...
 Given are five observations for two variables, and y. 1 2 3 5 Yi 3 7 5 11 14 The estimated regression equation for these data is ý = 0.2 +2.6z. a. Compute SSE, SST, and SSR using the following equations (to 1 decimal). SSE = Sy.- SST = = (y - SSR = = (y - SSE SST SSR b. Compute the coefficient of determination (to 3 decimals). Does this least squares line provide a good fit? Yes, the...
 (I) Let's start with very simple data table 1.0 2.0 3.0 4.0 5.0 6.0 -1 ± 1.8 4±2.0 9+ 1.0 14 + 0.8 19 s 0.8 24 + 1.2 2% 1.8 34 ± 2.0 7.0 8.0 9.0 1. Plot a graph of y vs. X on a piece of graph paper 2. Is it a straight line? Draw the best-fit line. 3. Compute the slope and y-intercept for this line. Write the equation for y in terms of x using...
 thanks for the help
Each of the following two data sets represents a straight line. 1. Draw a graph (plot the data points and draw the best-fit-straight-line) for each data set (first line vs. second line for each data set). 2. Find the slope of the line-of-best-fit in if plot is linear. 3. Show the calculation of the slope of graph for the corresponding case in the space below 4. Determine the equations of the curve of best fit for...
thanks for the help
Each of the following two data sets represents a straight line. 1. Draw a graph (plot the data points and draw the best-fit-straight-line) for each data set (first line vs. second line for each data set). 2. Find the slope of the line-of-best-fit in if plot is linear. 3. Show the calculation of the slope of graph for the corresponding case in the space below 4. Determine the equations of the curve of best fit for...
 Examine the scatter plot. a) Draw a line of best fit through the following data. [1] [1] b) Predict a correlation coefficient that would describe this data. c) Describe how the line of best fit would change without the influential point on the right d) The x-axis is amount of snowfall and the y-axis is cars on the road. Make a conclusion about this data, 100 98 96 8 24 2000 = 100 8 85 84 1966 1967 19es 1989...
Most questions answered within 3 hours.
-
Given:
Curent Assets: $600,000
Total Assets: $2,600,000
Current Liabilities: $500,000
Total Liabilities: $1,700,000
What is the...
asked 9 seconds ago -
A transverse wave on a cord is given by
D(x,t)=0.18sin(2.7x−61.0t), where Dand x are in m...
asked 4 minutes ago -
ASSIGNMENT
ANSWER ANY TWO OF THE FOLLOWING IN 2-3 PARAGRAPHS OF EACH
QUESTION.
1: Where is...
asked 3 minutes ago -
Question 1 (5 marks)
Studies have shown that the price elasticity for GP
consultations is -0.2...
asked 5 minutes ago -
The owner of 22 restaurants was asked how he does marketing
research. He answered that he...
asked 9 minutes ago -
The premium on a June 17 British pound call option with a strike
price of $1.2560...
asked 25 minutes ago -
We sometimes have to choose between the highest NPV and IRR;
will we not always get...
asked 20 minutes ago -
How do ethical issues affect decision making and what ethical
issues do you see in the...
asked 22 minutes ago -
Calculate the moment
of inertia (in kg·m2) of a skater given the following
information.
(a)
The...
asked 38 minutes ago -
A small body of mass m performs small oscillations sliding (no
rolling) along the bottom of...
asked 42 minutes ago -
The electric field in the region between two oppositely charged,
parallel, conducting plates has a magnitude...
asked 41 minutes ago -
A simple random sample was taken to test the claim that the
population mean is no...
asked 2 hours ago