


Complete: Chapter 12 Problen Set Using the data provided, complete the partial ANOVA summary table that follows. (Hint: T, the treatment total, can be calculated as the sample mean times the number of observations. G, the grand total, can be calculated from the have (Ss) df Between treatments 22,500.00 31,500.00 21,000.00 367,500.00 treatments In some ANOVA summary tables you will see, the labels in the first (source) column are T Which of the following reasons best explains why the within-treatments sum of the 'error sum of squares"? are Treatment, Error, and Total. squares is sometimes referred to as O Differences among members of the sample who received the same treatment occur when the researcher makes an error, and thus these differences are sometimes referred to as "error. O The within- sum of squares measures treatment effects as well as random, u all of within each of the samples assigned to each of the treatments. These d the variations that could occur in a study; therefore, they are sometimes referred to as "error. O Differences among members of the sample who received the same treatment occur because some treatments are more effective than others, so it would be an error to receive the less superior treatments The within-treatments sum of squares measures random, unsystematic differences within each of the samples assigned to each of the treatments. These differences are not due to treatment effects because everyone error." within each sample received the same treatment; therefore, the differences are sometimes referred to as O een-treatments variance and the within of the In ANOVA, the F test statistic is the H&C
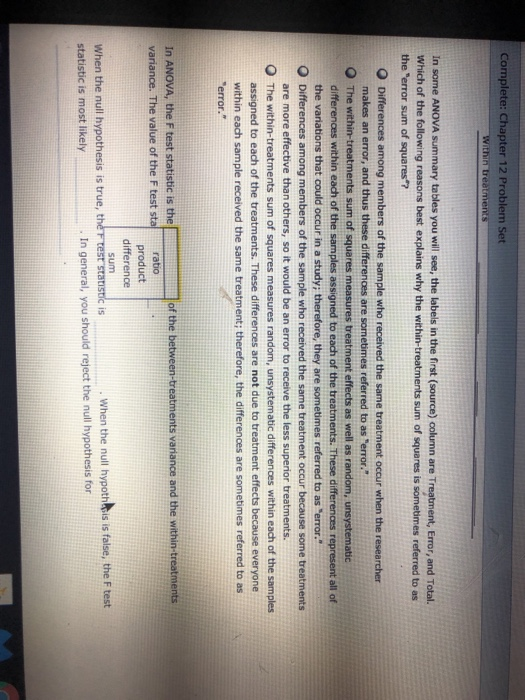
Complete: Chapter 12 Problem Set in some ANOVA summary tables you will see, the labels in the first (source) column are Treatment, Error, and Total. Which of the following reasons best explains why the within-treatments sum of squares is sometimes referred to as the "error sum of squares? O Differences among members of the sample who received the same treatment occur when the researcher makes an error, and thus these differences are sometimes referred to as "error. O The within-treatments sum of squares measures treatment effects as well as random, unsystematic within each of the samples assigned to each of the treatments. These d represent all of the variations that could occur in a study; therefore, they are sometimes referred to as error." O Differences among members of the sample who received the same treatment occur because some treatments are more effective than others, so it would be an error to receive the less superior treatments. O The within-treatments sum of squares measures random, unsystematic differences within each of the samples assigned to each of the treatments. These differences are not due to treatment effects because everyone within each sample received the same treatment; therefore, the differences are sometimes referred to as error." In ANOVA, the F test statistic is theof the between-treatments variance and the within-treatments variance. The value of the F test sta ratio product difference sum . When the null hypothesis is false, the F test is When the null hypothesis is true, t statistic is most likely . In general, you should reject the null hypothesis for
12 These di sum of squares measures random error." is 4.20 0.26 In
within each of the samples assigned to each of the tr s. These differences represent all of referred to as "error. error. of the In general, you close to (0
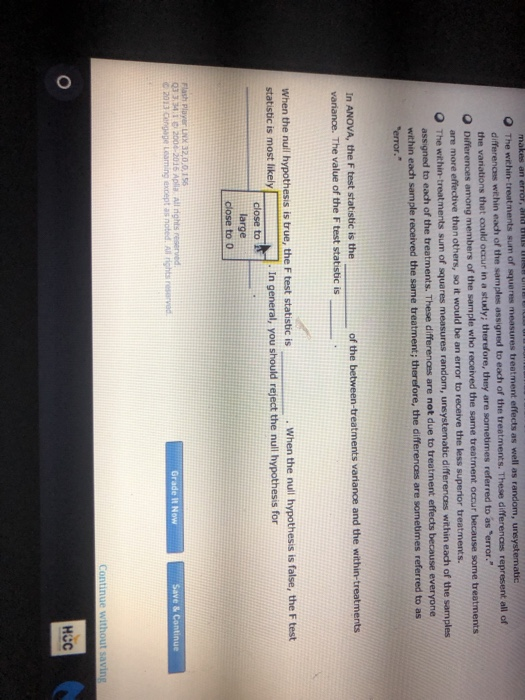
all of These d di the referred to as error." among n e effective than others, so it would be an error to receive the less superior treatments. are mor c differences within each of the samples O The within-treatments sum of squares measures random, un assigned to each of the treatments. These differences are not due to treatment effects because everyone within each sample received the same treatment; therefore, the differences are sometimes referred to as error." In ANOVA, the F test statistic is the variance. The value of the F test statistic is of the When the null hypothesis is true, the F test statistic is close to close to 0 When the null hypothesis is false, the F test statistic is most likely In general, you should reject the null hypothesis for large 03 3.341 Grade It Now Continue without saving
ne sample who received the same treatment occur when the researcher makes an error, and thus these differences are sometimes referred to as "error." 0 The within-treatments sum of squares measures treatment effects as well as random differences within each of the samples assigned to eadh of the treatments. These differences represent all of the variations that could occur in a study; therefore, they are sometimes referred to as 'error." O Differences among members of the sample whe received the same treatment occur because some treatments are more effective than others, so it would be an error to receive the less superior treatments. O The within-treatments sum of squares measures random, unsystemati c differences within each of the samples assigned to each of the treatments. These differences are not due to treatment effects because everyone within each sample received the same treatment; therefore, the differences are sometim "error." es referred to as In ANOVA, the F test statistic is the variance. The value of the F test statistic is of the between-treatments variance and the within-treatments When the null hypothesis is true, the F test statistic is statistic is most likely When the null hypothesis is false, the F test . In general, you should reject the null hypothesis for values of the F test close to 1 large values of the F test statistic values of the F test statistic close to 0 Nb
Homework Answers


Add Answer to:
CENGAGE I MINDTAP Complete: Chapter 12 Problem Set 6. ANOVA calculations and rejection of the nul...
Attempts: Average: /12 ANOVA calculations and rejection of the null hypothesis Aa Aa The followin...
 Please answer all parts
Attempts: Average: /12 ANOVA calculations and rejection of the null hypothesis Aa Aa The following table summarizes the results of a study on SAT prep courses, comparing SAT scores of students in a private preparation class, a high school preparation class, and no preparation class. Use the information from the table to answer the remaining questions. Number of Sum of Observations Sample Mean Squares (SS) 650 645 625 Treatment Private prep class High school prep class...
Please answer all parts
Attempts: Average: /12 ANOVA calculations and rejection of the null hypothesis Aa Aa The following table summarizes the results of a study on SAT prep courses, comparing SAT scores of students in a private preparation class, a high school preparation class, and no preparation class. Use the information from the table to answer the remaining questions. Number of Sum of Observations Sample Mean Squares (SS) 650 645 625 Treatment Private prep class High school prep class...
Source Between treatments Within treatments Sum of Squares (Ss) df Mean Square (MS) 2 310,050.00 2,650.00 In some ANOVA summary tables you will see, the labels in the first (source) column are Treatm...
 Source Between treatments Within treatments Sum of Squares (Ss) df Mean Square (MS) 2 310,050.00 2,650.00 In some ANOVA summary tables you will see, the labels in the first (source) column are Treatment, Error, and Total Which of the following reasons best explains why the within-treatments sum of squares is sometimes referred to as the "error sum of squares"? O Differences among members of the sample who received the same treatment occur when the researcher O Differences among members of...
In some ANOVA summary tables you will see, the labels in the first (source) column are Treatment, Error, and Total Whic...
 In some ANOVA summary tables you will see, the labels in the first (source) column are Treatment, Error, and Total Which of the following reasons best explains why the within-treatments variance is sometimes referred to as the error variance"? O The within-treatments variance measures random, unsystematic differences within each of the samples assigned to each of the treatments. These differences are not due to treatment effects because everyone within each sample received the same treatment; therefore, the differences are sometimes...
The following table summarizes the results of a study on SAT prep courses, comparing SAT scores...
 The following table summarizes the results of a study on SAT prep courses, comparing SAT scores of students in a private preparation class, a high school preparation class, and no preparation class. Use the information from the table to answer the remaining questions Number of Sum of Treatment Private prep class High school prep class No prep class Observations Sample Mean Squares (SS) 690 680 640 60 60 60 265,500.00 276,120.00 302,670.00 Using the data provided, complete the partial ANOVA...
Please help with the following multiple choice 1. In the one-way ANOVA where there are k...
Please help with the following multiple choice 1. In the one-way ANOVA where there are k treatments and n observations, the degrees of freedom for the F-statistic are equal to, respectively: a. n and k. b. k and n. c. n − k and k − 1. d. k − 1 and n − k. 2. In ANOVA, the F-test is the ratio of two sample variances. In the one-way ANOVA (completely randomized design), the variance used as a numerator...
Suppose the Total Sum of Squares (SST) for a completely randomzied design with ?=6k=6 treatments and...
Suppose the Total Sum of Squares (SST) for a completely randomzied design with ?=6k=6 treatments and ?=18n=18 total measurements is equal to 500500. In each of the following cases, conduct an ?F-test of the null hypothesis that the mean responses for the 66 treatments are the same. Use ?=0.025α=0.025. (a) The Treatment Sum of Squares (SSTR) is equal to 350350 while the Total Sum of Squares (SST) is equal to 500500. The test statistic is?=F= The critical value is ?=F=...
Suppose the Total Sum of Squares (SST) for a completely randomzied design with k=6 treatments and...
Suppose the Total Sum of Squares (SST) for a completely randomzied design with k=6 treatments and n=24 total measurements is equal to 400. In each of the following cases, conduct an FF-test of the null hypothesis that the mean responses for the 66 treatments are the same. Use α=0.01. (a) The Treatment Sum of Squares (SSTR) is equal to 200 while the Total Sum of Squares (SST) is equal to 400. The test statistic is F= The critical value is...
4. ANOVA calculations and rejection of the null hypothesis The following table summarizes the results of...
 4. ANOVA calculations and rejection of the null hypothesis The following table summarizes the results of a study on SAT prep courses, comparing SAT scores of students in a private preparation dlass, a high school preparation dlass, and no preparation dass. Use the information from the table to answer the remaining questions. Number of Observations Treatment Sample Mean Sum of Squares (SS) Private prep dlass 40 610 97,500.00 High school prep class 40 600 101,400.00 No prep class 40 590...
Topic: ANOVA Topic: ANOVA 1- An experiment was conducted using a randomized block design. The data...
Topic: ANOVA Topic: ANOVA 1- An experiment was conducted using a randomized block design. The data from the experiment are displayed in the following table. Block Treatment 1 2 3 1 2 3 5 2 8 6 7 3 7 6 5 a) Fill in the missing entries in the ANOVA table. Source df SS MS F Treatment 2 21.5555 Block 2 Error 4 Total 8 30.2222 b) Specify the null use to investigate whether a difference exists among the...
QUESTION 4 The following is the ANOVA data obtained from a balanced CRD: ANOVA: Source of...
 QUESTION 4 The following is the ANOVA data obtained from a balanced CRD: ANOVA: Source of Variation Degree of Freedom Sum of Squares Mean Squares F-calculated 12.2 TRT ERROR 1 92.4 --- 22 45 TOTAL L Your are interested to evaluate treatments effects using the following hypothesis: Ho: M1 = M2 = ... Mt ---against--- Ha: 41 * M2 7... Mt 1. What is the number of treatments in this experiment? (place your answer in the box below) 2. Evaluate...
 Please answer all parts
Attempts: Average: /12 ANOVA calculations and rejection of the null hypothesis Aa Aa The following table summarizes the results of a study on SAT prep courses, comparing SAT scores of students in a private preparation class, a high school preparation class, and no preparation class. Use the information from the table to answer the remaining questions. Number of Sum of Observations Sample Mean Squares (SS) 650 645 625 Treatment Private prep class High school prep class...
Please answer all parts
Attempts: Average: /12 ANOVA calculations and rejection of the null hypothesis Aa Aa The following table summarizes the results of a study on SAT prep courses, comparing SAT scores of students in a private preparation class, a high school preparation class, and no preparation class. Use the information from the table to answer the remaining questions. Number of Sum of Observations Sample Mean Squares (SS) 650 645 625 Treatment Private prep class High school prep class...
 Source Between treatments Within treatments Sum of Squares (Ss) df Mean Square (MS) 2 310,050.00 2,650.00 In some ANOVA summary tables you will see, the labels in the first (source) column are Treatment, Error, and Total Which of the following reasons best explains why the within-treatments sum of squares is sometimes referred to as the "error sum of squares"? O Differences among members of the sample who received the same treatment occur when the researcher O Differences among members of...
 In some ANOVA summary tables you will see, the labels in the first (source) column are Treatment, Error, and Total Which of the following reasons best explains why the within-treatments variance is sometimes referred to as the error variance"? O The within-treatments variance measures random, unsystematic differences within each of the samples assigned to each of the treatments. These differences are not due to treatment effects because everyone within each sample received the same treatment; therefore, the differences are sometimes...
 The following table summarizes the results of a study on SAT prep courses, comparing SAT scores of students in a private preparation class, a high school preparation class, and no preparation class. Use the information from the table to answer the remaining questions Number of Sum of Treatment Private prep class High school prep class No prep class Observations Sample Mean Squares (SS) 690 680 640 60 60 60 265,500.00 276,120.00 302,670.00 Using the data provided, complete the partial ANOVA...
 4. ANOVA calculations and rejection of the null hypothesis The following table summarizes the results of a study on SAT prep courses, comparing SAT scores of students in a private preparation dlass, a high school preparation dlass, and no preparation dass. Use the information from the table to answer the remaining questions. Number of Observations Treatment Sample Mean Sum of Squares (SS) Private prep dlass 40 610 97,500.00 High school prep class 40 600 101,400.00 No prep class 40 590...
 QUESTION 4 The following is the ANOVA data obtained from a balanced CRD: ANOVA: Source of Variation Degree of Freedom Sum of Squares Mean Squares F-calculated 12.2 TRT ERROR 1 92.4 --- 22 45 TOTAL L Your are interested to evaluate treatments effects using the following hypothesis: Ho: M1 = M2 = ... Mt ---against--- Ha: 41 * M2 7... Mt 1. What is the number of treatments in this experiment? (place your answer in the box below) 2. Evaluate...
Most questions answered within 3 hours.
-
While rotating the tires on your car you notice a rock [mass =
0.1 Kg] stuck...
asked 1 hour ago -
Using MARS simulator, write MIPS programs according to
the following scenarios: Receive a positive integer number...
asked 3 hours ago -
An object in front of a concave mirror has a real image that is
11.5 cm...
asked 3 hours ago -
Consider the reaction, C3 H8 + O2 --> CO2 + H2O. How many
moles of O2...
asked 5 hours ago -
You and your opponent both roll a fair die. If you both roll the
same number,...
asked 5 hours ago -
In a study of the accuracy of fast food drive-through orders,
Restaurant A had 257 accurate...
asked 5 hours ago -
Identify and describe in detail the four categories of
institutions that could be included in a...
asked 5 hours ago -
In python
class Customer:
def __init__(self, customer_id, last_name, first_name, phone_number, address):
self._customer_id = int(customer_id)
self._last_name =...
asked 6 hours ago -
What is an example of a limitation in implementing a new
ERP system and how it...
asked 5 hours ago -
In a section of 9.7cm of an artery with a radius of 2.6mm there
is a...
asked 5 hours ago -
the two carboxylic acid groups of aspartic acid have different
acidities with pKa values of 2.1...
asked 6 hours ago -
Would CuCO3 aqueous salt combined with calcium chloride
form a solid precipitate? If so, what would...
asked 6 hours ago