Visit the NASDAQ historical prices weblink. First, set the date range to be for exactly 1 year en...
Visit the NASDAQ historical prices weblink. First, set the date range to be for exactly 1 year ending on the Monday that this course started. For example, if the current term started on April 1, 2018, then use April 1, 2017 – March 31, 2018. (Do NOT use these dates. Use the dates that match up with the current term.) Do this by clicking on the blue dates after “Time Period”. Next, click the “Apply” button. Next, click the link on the right side of the page that says “Download Data” to save the file to your computer. DATES FOR THIS TERM IS 2/18 - 4/18 - 2019
This project will only use the Close values. Assume that the closing prices of the stock form a normally distributed data set. This means that you need to use Excel to find the mean and standard deviation. Then, use those numbers and the methods you learned in sections 6.1-6.3 of the course textbook for normal distributions to answer the questions. Do NOT count the number of data points.
Complete this portion of the assignment within a single Excel file. Show your work or explain how you obtained each of your answers. Answers with no work and no explanation will receive no credit.
- a) Submit a copy of your dataset along with a file that contains your answers to all of the following questions.
b) What the mean and Standard Deviation (SD) of the Close column in your data set?
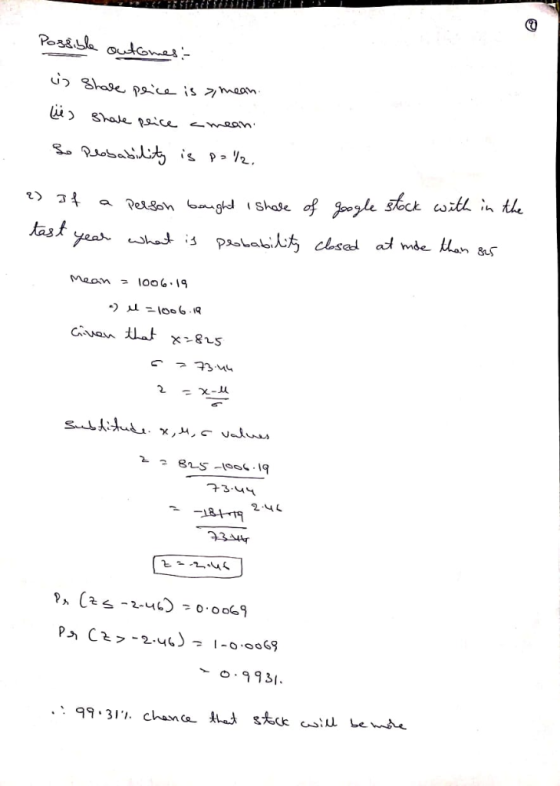
c) If a person bought 1 share of Google stock within the last year, what is the probability that the stock on that day closed at less than the mean for that year?
- If a person bought 1 share of Google stock within the last year, what is the probability that the stock on that day closed at more than $950?
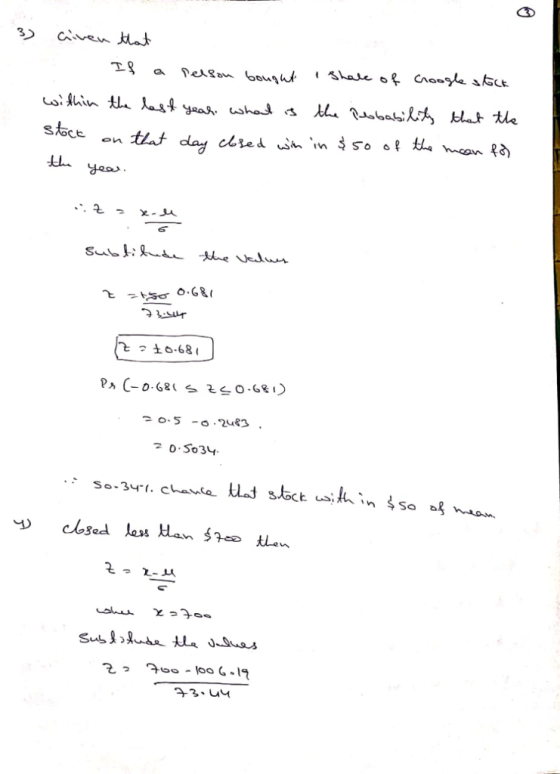
- If a person bought 1 share of Google stock within the last year, what is the probability that the stock on that day closed within $50 of the mean for that year? (between 50 below and 50 above the mean) (5 points)
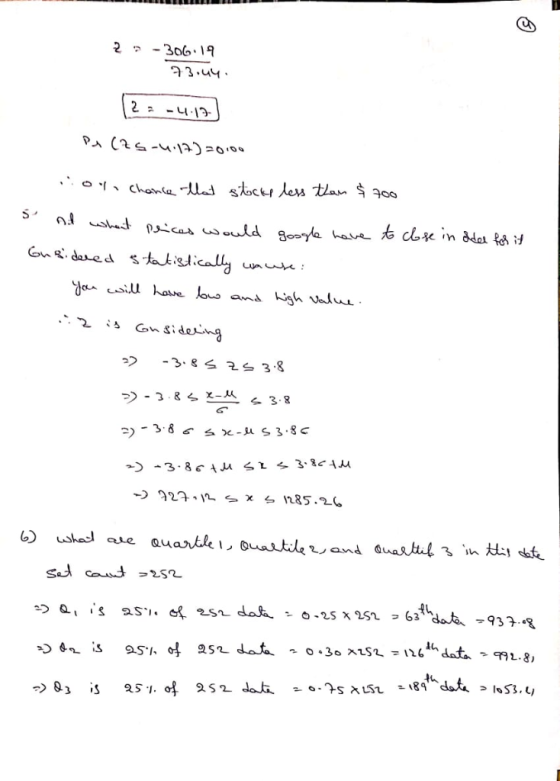
- If a person bought 1 share of Google stock within the last year, what is the probability that the stock on that day closed at less than $800 per share. Would this be considered unusal? Use the definition of unusual from the course textbook that is measured as a number of standard deviations (5 points)
- At what prices would Google have to close in order for it to be considered statistically unusual? You will have a low and high value. Use the definition of unusual from the course textbook that is measured as a number of standard deviations. (5 points)
- What are Quartile 1, Quartile 2, and Quartile 3 in this data set? Use Excel to find these values. This is the only question that you must answer without using anything about the normal distribution. (5 points)
- Is the normality assumption that was made at the beginning valid? Why or why not? Hint: Does this distribution have the properties of a normal distribution as described in the course textbook? Real data sets are never perfect, however, it should be close. One option would be to construct a histogram like you did in Project 1 to see if it has the right shape. Something in the range of 10 to 12 classes is a good number. (5 points)
There are also 5 points for miscellaneous items like correct date range, correct mean, correct SD, etc.
Homework Answers


Add Answer to:
Visit the NASDAQ historical prices weblink. First, set the date range to be for exactly 1 year en...
Visit the NASDAQ historical prices weblink. First, set the date range to be for exactly 1 year en...
Visit the NASDAQ historical prices weblink. First, set the date range to be for exactly 1 year ending on the Monday that this course started. For example, if the current term started on April 1, 2018, then use April 1, 2017 – March 31, 2018. (Do NOT use these dates. Use the dates that match up with the current term.) MY DATES ARE MARCH 18 2018 - MARCH 19 2019 Do this by clicking on the blue dates after “Time...
Visit the NASDAQ historical prices weblink. First, set the date range to be for exactly 1...
 Visit the NASDAQ historical prices weblink. First, set the date
range to be for exactly 1 year ending on the Monday that this
course started. Use March 18, 2018 – March 19, 2019. Do this by
clicking on the blue dates after “Time Period”. Next, click the
“Apply” button. Next, click the link on the right side of the page
that says “Download Data” to save the file to your computer.
This project will only use the Close values. Assume...
Visit the NASDAQ historical prices weblink. First, set the date
range to be for exactly 1 year ending on the Monday that this
course started. Use March 18, 2018 – March 19, 2019. Do this by
clicking on the blue dates after “Time Period”. Next, click the
“Apply” button. Next, click the link on the right side of the page
that says “Download Data” to save the file to your computer.
This project will only use the Close values. Assume...
Visit the NASDAQ historical prices weblink. UPDATE: Copy and Paste https://finance.yahoo.com/quot...
Visit the NASDAQ historical prices weblink. UPDATE: Copy and Paste https://finance.yahoo.com/quote/GOOG/history/ Or here are the numbers 1175.76 1142.32 1143.3 1157.86 1162.03 1147.8 1140.99 1119.92 1116.05 1115.13 1109.4 1110.37 1096.97 1113.8 1118.56 1113.65 1121.67 1120.16 1121.37 1095.01 1095.06 1098.71 1115.23 1145.99 1132.8 1110.75 1116.37 1089.06 1060.62 1070.08 1090.99 1073.9 1075.57 1070.52 1098.26 1089.9 1080.97 1077.15 1044.69 1057.19 1070.33 1074.66 1076.28 1068.39 1070.71 1016.06 1045.85 1035.61 1037.08 1043.88 1039.46 976.22 979.54 1009.41 1023.01 1028.71 1016.53 1042.1 1061.9 1063.68 1051.75 1039.55 1036.58 1068.73...
PROJECT 3 INSTRUCTIONS Based on Brase & Brase : sections 6.1-6.3 Note that you must do this Visit...
 continuation to previous question
PROJECT 3 INSTRUCTIONS Based on Brase & Brase : sections 6.1-6.3 Note that you must do this Visit the NASDAQ historical prices weblink. First, set the date range to be for exactly 1 year ending on that says "Download Data" to save the file project on your to your computer This project will only use the Close values. Assume that the closing prices of the stock form a normally distributed data set. This means that you...
continuation to previous question
PROJECT 3 INSTRUCTIONS Based on Brase & Brase : sections 6.1-6.3 Note that you must do this Visit the NASDAQ historical prices weblink. First, set the date range to be for exactly 1 year ending on that says "Download Data" to save the file project on your to your computer This project will only use the Close values. Assume that the closing prices of the stock form a normally distributed data set. This means that you...
please can you solve for all these questions but the right answers because I dont have...
 please can you solve for all
these questions but the right answers because I dont have anymore
remaining please
a) What is the market cap? b) What are the earnings per share? (TTM after EPS stands for "trailing twelve months", i.e. their reported earnings per share for the last 12 month period) c) What is their PE ratio? Click on the "Chart" menu item. Click on the "18" option to get a chart of stock prices for the last year....
please can you solve for all
these questions but the right answers because I dont have anymore
remaining please
a) What is the market cap? b) What are the earnings per share? (TTM after EPS stands for "trailing twelve months", i.e. their reported earnings per share for the last 12 month period) c) What is their PE ratio? Click on the "Chart" menu item. Click on the "18" option to get a chart of stock prices for the last year....
Q2. The underlying principle of all statistical inference is one that uses sample statistics to learn something...
 Q2. The underlying principle of all statistical inference is one that uses sample statistics to learn something (that is to infer) about population parameter. Convince me that you understand this statement by writing a short paragraph describing an example in which you might use a sample estimate to infer about a population parameter. Clearly identify and define the terms: population, parameter, sample, sample-estimate and sample error in your example. Be as specific as possible. You may make up numbers. [8...
Fred purchased 100 shares of Ekto Corporation common stock for $30.3 per share on June 1,...
Fred purchased 100 shares of Ekto Corporation common stock for $30.3 per share on June 1, 2001 and then sold it exactly 11 years later for $43.91 per share. What was Fred's geometric mean average annual return on this investment? 4.08% 2.82% 3.43% 2.48% 1 points QUESTION 6 Fred purchased 100 shares of Ekto Corporation common stock for $31.99 per share on June 1, 2001 and then sold it exactly 3 years later for $43.53 per share. What was...
Please Answer ONLY F1, F2 and G . Thanks Problem: Daycare Management You've been hired as...
 Please Answer ONLY F1, F2 and G .
Thanks
Problem: Daycare Management You've been hired as the Chief Statistician for the SummerlsFun Co. The corporation operates a variety of Summer Children Camp/Daycare chains: ParentsOasis SunAndPlay NoPlaceLikeHome As part of their ongoing marketing effort, SummerIsFun Co. collects a variety of statistics about their members. The database includes the following data (a) Child's age category: infant, toddlers, preschool, pre-K к} (b) Child's BMI category: underweight, normal weight overweight, obese (e) Number of...
Please Answer ONLY F1, F2 and G .
Thanks
Problem: Daycare Management You've been hired as the Chief Statistician for the SummerlsFun Co. The corporation operates a variety of Summer Children Camp/Daycare chains: ParentsOasis SunAndPlay NoPlaceLikeHome As part of their ongoing marketing effort, SummerIsFun Co. collects a variety of statistics about their members. The database includes the following data (a) Child's age category: infant, toddlers, preschool, pre-K к} (b) Child's BMI category: underweight, normal weight overweight, obese (e) Number of...
Please answer all of the following. The boxplot below shows the number of contacts in their...
 Please answer all of the following.
The boxplot below shows the number of contacts in their cell by gender for my Spring 2018 statistics classes. Using the boxplot, answer the 4 questions below. Boxplot of CellNumbers 900 800 700 600 500 400 300 200 100 0 Male Female Gender CellNumbers Which distribution has 3 outliers? Which distribution appears skewed right, excluding 1. Male 1 outliers? 2. Female Which distribution is 1 3. Both less variable (has the smaller IQR)? 4....
Please answer all of the following.
The boxplot below shows the number of contacts in their cell by gender for my Spring 2018 statistics classes. Using the boxplot, answer the 4 questions below. Boxplot of CellNumbers 900 800 700 600 500 400 300 200 100 0 Male Female Gender CellNumbers Which distribution has 3 outliers? Which distribution appears skewed right, excluding 1. Male 1 outliers? 2. Female Which distribution is 1 3. Both less variable (has the smaller IQR)? 4....
NE EXAM- Sampling and Descriptive Statistics Davon Brunes: Attempt 1 Question 8 (5 points) Match the...
 NE EXAM- Sampling and Descriptive Statistics Davon Brunes: Attempt 1 Question 8 (5 points) Match the following statements that refer to a bell-shaped data set. Within one standard deviation Approximately 68% of the data lie in this interval 1. of the mean Within three standard deviations of the mean Within two standard deviations of the mean Approximately 95% of the data lie in this interval 2. All or almost all of the data lie in this interval 3, Question 9...
 Visit the NASDAQ historical prices weblink. First, set the date
range to be for exactly 1 year ending on the Monday that this
course started. Use March 18, 2018 – March 19, 2019. Do this by
clicking on the blue dates after “Time Period”. Next, click the
“Apply” button. Next, click the link on the right side of the page
that says “Download Data” to save the file to your computer.
This project will only use the Close values. Assume...
Visit the NASDAQ historical prices weblink. First, set the date
range to be for exactly 1 year ending on the Monday that this
course started. Use March 18, 2018 – March 19, 2019. Do this by
clicking on the blue dates after “Time Period”. Next, click the
“Apply” button. Next, click the link on the right side of the page
that says “Download Data” to save the file to your computer.
This project will only use the Close values. Assume...
 continuation to previous question
PROJECT 3 INSTRUCTIONS Based on Brase & Brase : sections 6.1-6.3 Note that you must do this Visit the NASDAQ historical prices weblink. First, set the date range to be for exactly 1 year ending on that says "Download Data" to save the file project on your to your computer This project will only use the Close values. Assume that the closing prices of the stock form a normally distributed data set. This means that you...
continuation to previous question
PROJECT 3 INSTRUCTIONS Based on Brase & Brase : sections 6.1-6.3 Note that you must do this Visit the NASDAQ historical prices weblink. First, set the date range to be for exactly 1 year ending on that says "Download Data" to save the file project on your to your computer This project will only use the Close values. Assume that the closing prices of the stock form a normally distributed data set. This means that you...
 please can you solve for all
these questions but the right answers because I dont have anymore
remaining please
a) What is the market cap? b) What are the earnings per share? (TTM after EPS stands for "trailing twelve months", i.e. their reported earnings per share for the last 12 month period) c) What is their PE ratio? Click on the "Chart" menu item. Click on the "18" option to get a chart of stock prices for the last year....
please can you solve for all
these questions but the right answers because I dont have anymore
remaining please
a) What is the market cap? b) What are the earnings per share? (TTM after EPS stands for "trailing twelve months", i.e. their reported earnings per share for the last 12 month period) c) What is their PE ratio? Click on the "Chart" menu item. Click on the "18" option to get a chart of stock prices for the last year....
 Q2. The underlying principle of all statistical inference is one that uses sample statistics to learn something (that is to infer) about population parameter. Convince me that you understand this statement by writing a short paragraph describing an example in which you might use a sample estimate to infer about a population parameter. Clearly identify and define the terms: population, parameter, sample, sample-estimate and sample error in your example. Be as specific as possible. You may make up numbers. [8...
 Please Answer ONLY F1, F2 and G .
Thanks
Problem: Daycare Management You've been hired as the Chief Statistician for the SummerlsFun Co. The corporation operates a variety of Summer Children Camp/Daycare chains: ParentsOasis SunAndPlay NoPlaceLikeHome As part of their ongoing marketing effort, SummerIsFun Co. collects a variety of statistics about their members. The database includes the following data (a) Child's age category: infant, toddlers, preschool, pre-K к} (b) Child's BMI category: underweight, normal weight overweight, obese (e) Number of...
Please Answer ONLY F1, F2 and G .
Thanks
Problem: Daycare Management You've been hired as the Chief Statistician for the SummerlsFun Co. The corporation operates a variety of Summer Children Camp/Daycare chains: ParentsOasis SunAndPlay NoPlaceLikeHome As part of their ongoing marketing effort, SummerIsFun Co. collects a variety of statistics about their members. The database includes the following data (a) Child's age category: infant, toddlers, preschool, pre-K к} (b) Child's BMI category: underweight, normal weight overweight, obese (e) Number of...
 Please answer all of the following.
The boxplot below shows the number of contacts in their cell by gender for my Spring 2018 statistics classes. Using the boxplot, answer the 4 questions below. Boxplot of CellNumbers 900 800 700 600 500 400 300 200 100 0 Male Female Gender CellNumbers Which distribution has 3 outliers? Which distribution appears skewed right, excluding 1. Male 1 outliers? 2. Female Which distribution is 1 3. Both less variable (has the smaller IQR)? 4....
Please answer all of the following.
The boxplot below shows the number of contacts in their cell by gender for my Spring 2018 statistics classes. Using the boxplot, answer the 4 questions below. Boxplot of CellNumbers 900 800 700 600 500 400 300 200 100 0 Male Female Gender CellNumbers Which distribution has 3 outliers? Which distribution appears skewed right, excluding 1. Male 1 outliers? 2. Female Which distribution is 1 3. Both less variable (has the smaller IQR)? 4....
 NE EXAM- Sampling and Descriptive Statistics Davon Brunes: Attempt 1 Question 8 (5 points) Match the following statements that refer to a bell-shaped data set. Within one standard deviation Approximately 68% of the data lie in this interval 1. of the mean Within three standard deviations of the mean Within two standard deviations of the mean Approximately 95% of the data lie in this interval 2. All or almost all of the data lie in this interval 3, Question 9...
Most questions answered within 3 hours.
-
Construction Cost Analysis and Estimating:
A project requires 17,000 allowed hours. Location of the work is...
asked 7 minutes ago -
1: In 802.11b, Access Point (AP) delivers a nonce to the Station
(STA). This nonce is...
asked 7 minutes ago -
calculate change in entropy and change in enthalpy for freezing
1 mol of water at -10C...
asked 14 minutes ago -
In your opinion, did anyone "win" the Cold War? If no, why? If
yes, who won...
asked 18 minutes ago -
a) Determine the saturation dissolved oxygen concentration at
sea-level at 1 atm and 20° C in...
asked 15 minutes ago -
Please complete the implementation of the four functions IN
C.
//************************************************************************************/
//
// countNumberofOnes
//
//...
asked 18 minutes ago -
Shown below are the budgeted sales for ABC Company for
the next six months:
Sales...
asked 22 minutes ago -
A balance sheet shows exactly where a business stands at any
given point in time. It...
asked 23 minutes ago -
For the reaction between ethylene and chlorine, the equilibrium
constant is 2.00x10^6. If the initial concentrations...
asked 31 minutes ago -
What is the energy released in this β+ nuclear reaction
23/12Mg→23/11Na+0/1e (The atomic mass of 23Mg...
asked 45 minutes ago -
Choose one:
Periodic Inventory Accounting is less expensive to maintain
than Perpetual Inventory Accounting
Periodic Inventory...
asked 43 minutes ago -
4. Describe the role played by glutamine in the transport of
nitrogen.
asked 41 minutes ago