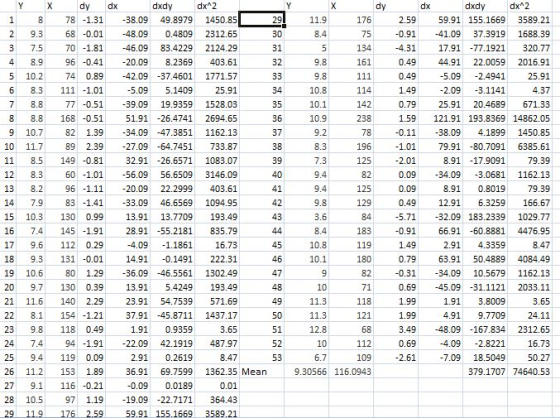
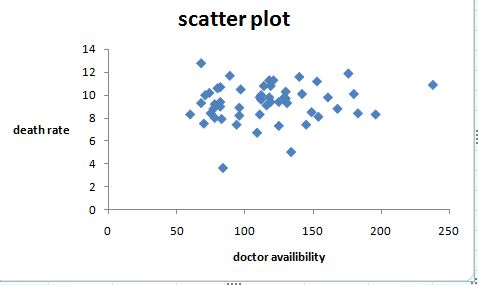
Compute Regression Analysis for following relationship: The relationship between death rate X1 vs. doctor availability X2. Doctor availability as a Predictor X, then death rate as a Response variable...
Compute Regression Analysis for following relationship: The relationship between death rate X1 vs. doctor availability X2. Doctor availability as a Predictor X, then death rate as a Response variable Y. Get the Regression Output and scatter plot between the variables using data analysis toolpak in Excel. X1= Death rate per 1000 residents. X2= doctor availability per 100,000 residents.
X1 X2
8 78
9.3 68
7.5 70
8.9 96
10.2 74
8.3 111
8.8 77
8.8 168
10.7 82
11.7 89
8.5 149
8.3 60
8.2 96
7.9 83
10.3 130
7.4 145
9.6 112
9.3 131
10.6 80
9.7 130
11.6 140
8.1 154
9.8 118
7.4 94
9.4 119
11.2 153
9.1 116
10.5 97
11.9 176
8.4 75
5 134
9.8 161
9.8 111
10.8 114
10.1 142
10.9 238
9.2 78
8.3 196
7.3 125
9.4 82
9.4 125
9.8 129
3.6 84
8.4 183
10.8 119
10.1 180
9 82
10 71
11.3 118
11.3 121
12.8 68
10 112
6.7 109
Homework Answers
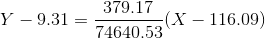
solution : X1 = Y........death rate, X2=X............doctor availability
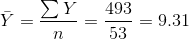
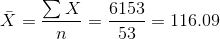
compute the following
 and
and 
regression equation of y on x =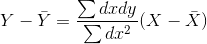

Add Answer to:
Compute Regression Analysis for following relationship: The relationship between death rate X1 vs. doctor availability X2. Doctor availability as a Predictor X, then death rate as a Response variable...
Compute Regression Analysis for following relationship: The relationship between death rate X1 (USD) vs. population density...
Compute Regression Analysis for following relationship: The relationship between death rate X1 (USD) vs. population density X5. Population as a Predictor, X, then death rate as a Response variable, Y. Get Regression Output, and Scatter plot between these variables and compute Coefficient of Determination, R2, and Interpret your findings. X1 X2 X3 X4 X5 The data (X1, X2, X3, X4, X5) are by city. 8 78 284 9.1 109 X1 = death rate per 1000 residents 9.3 68 433 8.7 144...
Compute the correlation coefficient, r, for all five variables (columns). Interpret your findings whether you have determined any relationship between variables. X1 X2 X3 X4 X5 The data (X1, X...
Compute the correlation coefficient, r, for all five variables (columns). Interpret your findings whether you have determined any relationship between variables. X1 X2 X3 X4 X5 The data (X1, X2, X3, X4, X5) are by city. 8 78 284 9.1 109 X1 = death rate per 1000 residents 9.3 68 433 8.7 144 X2 = doctor availability per 100,000 residents 7.5 70 739 7.2 113 X3 = hospital availability per 100,000 residents 8.9 96 1792 8.9 97 X4 = annual...
It is commonly believed that cities with wind speeds of 10 or more have different average...
It is commonly believed that cities with wind speeds of 10 or more have different average temperature from the cities with winds of less than 10 (mp/h). Use Pollutiondata and your statistical expertise to answer the questions: Is this a reasonable belief? 4. What test/procedure did you perform? a. One-sided t-test b. Two-sided t-test c. Regression d. Confidence interval 5. Statistical Interpretation a. Since P-value is small we are confident that the slope is not zero. b. Since P-value is...
We are interested in the relationship between the compensation of Chief Executive Officers (CEO) ...
We are interested in the relationship between the compensation of Chief Executive Officers (CEO) of firms and the return on equity of their respective firm, using the dataset below. The variable salary shows the annual salary of a CEO in thousands of dollars, so that y = 150 indicates a salary of $150,000. Similarly, the variable ROE represents the average return on equity (ROE)for the CEO’s firm for the previous three years. A ROE of 20 indicates an average return...
4.3 Analysis Assignment #4 Note 1: all assignments moving forward must adhere to the appropriate Six Ste...
 4.3 Analysis Assignment #4 Note 1: all assignments moving forward must adhere to the appropriate Six Step Process (SSP). As our study materials have specified, the SSP has 3 versions. Version 1 is to be used for all t-tests; for all correlation analyses and Version 3 is be used for all regression analyses. Note 2: The data sets for Q1, Q2 and Q3 below can be downloaded here. Week 4 Analysis Assignments.xlsx Q1: (30 points) Complete the following data analysis:...
QUESTION 7 The data set Beer Large, which can be found in StatCrunch Shared Data Sets,...
 QUESTION 7 The data set Beer Large, which can be found in StatCrunch Shared Data Sets, gives the Alcohol, Carbohydrates and Calories for different brands of beer. The explanatory variable is x + Carbohydrates and the response variable is Y - Calories. Use this information to answer: Calculate the correlation between carbohydrates and calories. (4 decimal places) Row vars varo var var 8 var9 var 10 2 الميا ABV 4.1 5.4 4.43 4.13 5.9 4.9 Carbs 2.6 13.7 5.8 5...
CASE 1-5 Financial Statement Ratio Computation Refer to Campbell Soup Company's financial Campbell Soup statements in...
 CASE 1-5 Financial Statement Ratio Computation Refer to Campbell Soup Company's financial Campbell Soup statements in Appendix A. Required: Compute the following ratios for Year 11. Liquidity ratios: Asset utilization ratios:* a. Current ratio n. Cash turnover b. Acid-test ratio 0. Accounts receivable turnover c. Days to sell inventory p. Inventory turnover d. Collection period 4. Working capital turnover Capital structure and solvency ratios: 1. Fixed assets turnover e. Total debt to total equity s. Total assets turnover f. Long-term...
 4.3 Analysis Assignment #4 Note 1: all assignments moving forward must adhere to the appropriate Six Step Process (SSP). As our study materials have specified, the SSP has 3 versions. Version 1 is to be used for all t-tests; for all correlation analyses and Version 3 is be used for all regression analyses. Note 2: The data sets for Q1, Q2 and Q3 below can be downloaded here. Week 4 Analysis Assignments.xlsx Q1: (30 points) Complete the following data analysis:...
 QUESTION 7 The data set Beer Large, which can be found in StatCrunch Shared Data Sets, gives the Alcohol, Carbohydrates and Calories for different brands of beer. The explanatory variable is x + Carbohydrates and the response variable is Y - Calories. Use this information to answer: Calculate the correlation between carbohydrates and calories. (4 decimal places) Row vars varo var var 8 var9 var 10 2 الميا ABV 4.1 5.4 4.43 4.13 5.9 4.9 Carbs 2.6 13.7 5.8 5...
 CASE 1-5 Financial Statement Ratio Computation Refer to Campbell Soup Company's financial Campbell Soup statements in Appendix A. Required: Compute the following ratios for Year 11. Liquidity ratios: Asset utilization ratios:* a. Current ratio n. Cash turnover b. Acid-test ratio 0. Accounts receivable turnover c. Days to sell inventory p. Inventory turnover d. Collection period 4. Working capital turnover Capital structure and solvency ratios: 1. Fixed assets turnover e. Total debt to total equity s. Total assets turnover f. Long-term...
Most questions answered within 3 hours.
-
Bread/Roll Label Evaluation Worksheet
Name of product
________________________________ Cost:
____________
1. What is the serving size?...
asked 1 minute from now -
would you recommend the water displacement method for matching
the density of a soil sample found...
asked 9 minutes ago -
a circular loop of wire of cross-sectional area 0.12 m2
consists of 200 turns, each carrying...
asked 13 minutes ago -
I need help with learning about lung cancer to be specific i
need to know in...
asked 10 minutes ago -
Suppose that the one-year interest rate is 5.0% in the United
States and 3.5% in Germany,...
asked 16 minutes ago -
What are the four traditional approaches to film history? What
are the specific concerns of each?
asked 18 minutes ago -
Calculate the equilibrium molar concentration of free
Zn2+(aq) in a solution that contains 0.021 mol of...
asked 16 minutes ago -
Write a reflective paragraph summarizing your
thoughts.
Organizational change research has been criticized for
neglecting the...
asked 20 minutes ago -
Respond to the following moral dilemma:
You are an inmate in a concentration
camp. A sadistic...
asked 21 minutes ago -
write a summary of the chapter: using technology to change the
world? this chapter is from...
asked 30 minutes ago -
The gas mileages (in miles per gallon) of 25 randomly selected
sports cars are listed in...
asked 31 minutes ago -
Calculate the pH at 25C of a 0.92 M solution of sodium
hypochlorite (NaClO). Note that...
asked 35 minutes ago