MATLAB. Design your own low-pass shelving filter which can boost the low frequency of given music signal. After designin...
MATLAB. Design your own low-pass shelving filter which can boost
the low frequency of given music signal. After designing filter,
apply the filter to the original music signal and observe the
result. Include following plots.
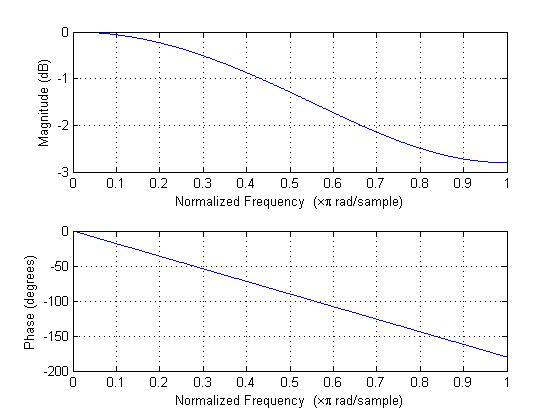
A. Magnitude and phase plot of your filter.
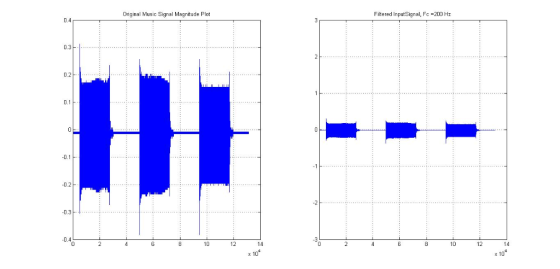
B. Magnitude plot of original signal
C. Magnitude plot of filtered signal
Homework Answers
MATLAB CODE
close all,
clear all,
clc,
ProjectPath = pwd;
MusicSignal_ = strcat(ProjectPath,'\Sample.wav');
[x, Fs, nbits] = wavread(MusicSignal_);
subplot(1,2,1); plot(x);
title('Original Music Signal Magnitude Plot');
%soundsc(y,Fs);
grid on,
Fc=200; %Cut off Freq in Hz
Order=2;
Wn = Fc/(Fs/2);
b = fir1(Order,Wn,'low'); hd = dfilt.dffir(b);
y = filter(hd,x);
subplot(1,2,2); plot(y); grid on, ylim([-3,3]);
str = strcat('Filtered InputSignal, Fc = ',num2str(Fc),' Hz');
title(str);
figure,
freqz(b,1,512);
Add Answer to:
MATLAB. Design your own low-pass shelving filter which can boost the low frequency of given music signal. After designin...
MATLAB. Design your own low-pass shelving filter which can boost the low frequency of given music signal. After designin...
MATLAB. Design your own low-pass shelving filter which can boost the low frequency of given music signal. After designing filter, apply the filter to the original music signal and observe the result. Include following plots. A. Magnitude and phase plot of your filter. B. Magnitude plot of original signal C. Magnitude plot of filtered signal
MATLAB. Design your own low-cut shelving filter which can cut the low frequency of given music signal. Include magnitude...
MATLAB. Design your own low-cut shelving filter which can cut the low frequency of given music signal. Include magnitude and phase plot of your filter.
Below is the MATLAB code of low-cut shelving filter which can cut the low frequency of given music signal and low-boost...
Below is the MATLAB code of low-cut shelving filter which can cut the low frequency of given music signal and low-boost shelving filter which can boost the low frequency of given music signal. Design your low-boost shelving filter and low-cut shelving filter to have noticeablly different sound. Compare the sounds of two music signals after filtering, and explain the difference in sounds briefly. If there are any mistakes in code, correct them. Low-cut shelving filter code: close all, clear all,...
MUST BE IN MATLAB Design a low pass filter for this signal. Set the pass band...
MUST BE IN MATLAB Design a low pass filter for this signal. Set the pass band frequency to 4.9 GHz and the stop band frequency to 5.6 GHz. Allow for 1 dB of attenuation in the pass band and require at least 20 dB of attenuation in the stop band. a. First design a Butterworth filter. Use the command buttord() to determine the order and the normalizing frequency for the filter. Use [Num,Den]=butter() to determine the numerator and denominator coefficients...
Design the following digital low pass filter. Filter should have corner frequency 100Hz. use sample periods...
Design the following digital low pass filter. Filter should have corner frequency 100Hz. use sample periods of 1 ms & 10 ms. 1.Second order filter with ζ = 1/ √ 2. Present your output on common magnitude & phase plots for filter variants, with one magnitude & phase plot for each sample period.
Using filterDesigner in MATLAB, design a second order low pass IIR Butterworth filter whose sampling frequency...
Using filterDesigner in MATLAB, design a second order low pass IIR Butterworth filter whose sampling frequency (Fs) is 1 kHz and cutoff frequency (Fc) is 10 Hz. Find the numerator and denominator coefficients. Write its transfer function H(z) = Y(z) / X(z). Write its difference function y(k). Draw (copy from Filter Designer) the magnitude response plot. Draw (copy from Filter Designer) the phase response plot. Draw (copy from Filter Designer) the impulse response plot.
Using the windowing functions discussed in class, design a low-pass FIR filter with a cutoff freq...
 Using the windowing functions discussed in class, design a
low-pass FIR filter with a cutoff frequency of 2 kHz, a minimum
stop band attenuation of 40 dB, and a transition width of 200Hz.
The sampling frequency is 10kHz.
1. Using the windowing functions discussed in class, design a low-pass FIR filter with a cutoff frequency of 2 kHz, a minimum stop band attenuation of 40 dB, and a transition width of 200 Hz. The sampling frequency is 10 kHz 2....
Using the windowing functions discussed in class, design a
low-pass FIR filter with a cutoff frequency of 2 kHz, a minimum
stop band attenuation of 40 dB, and a transition width of 200Hz.
The sampling frequency is 10kHz.
1. Using the windowing functions discussed in class, design a low-pass FIR filter with a cutoff frequency of 2 kHz, a minimum stop band attenuation of 40 dB, and a transition width of 200 Hz. The sampling frequency is 10 kHz 2....
1- The signal x(t) is applied to a low pass filter with cutoff frequency equal to...
 1- The signal x(t) is applied to a low pass filter with cutoff frequency equal to 1; write a MATLAB code to find and plot X(f), H(f) and the output of the filter Y(f), where x(t) is given below: x(t) -0.5 0.5 2- Apply the signal x(t) in the previous example to a HPF, BPF and BSF and draw the output signal Y(f). 3- Find and Plot the transfer function of BSF.
Using filterDesigner in MATLAB, design a second order low pass IIR Butterworth filter whose sampling frequency (Fs) is 1...
Using filterDesigner in MATLAB, design a second order low pass IIR Butterworth filter whose sampling frequency (Fs) is 1 kHz and cutoff frequency (Fc) is 10 Hz. Find the numerator and denominator coefficients. Write its transfer function H(z) = Y(z) / X(z). Write its difference function y(k). Draw (copy from Filter Designer) the magnitude response plot. Draw (copy from Filter Designer) the phase response plot. Draw (copy from Filter Designer) the impulse response plot.
design a FIR low-pass filter using the window method in MATLAB. Select an appropriate cutoff frequency...
design a FIR low-pass filter using the window method in MATLAB. Select an appropriate cutoff frequency (fc) to attenuate the 1 MHz signal
 Using the windowing functions discussed in class, design a
low-pass FIR filter with a cutoff frequency of 2 kHz, a minimum
stop band attenuation of 40 dB, and a transition width of 200Hz.
The sampling frequency is 10kHz.
1. Using the windowing functions discussed in class, design a low-pass FIR filter with a cutoff frequency of 2 kHz, a minimum stop band attenuation of 40 dB, and a transition width of 200 Hz. The sampling frequency is 10 kHz 2....
Using the windowing functions discussed in class, design a
low-pass FIR filter with a cutoff frequency of 2 kHz, a minimum
stop band attenuation of 40 dB, and a transition width of 200Hz.
The sampling frequency is 10kHz.
1. Using the windowing functions discussed in class, design a low-pass FIR filter with a cutoff frequency of 2 kHz, a minimum stop band attenuation of 40 dB, and a transition width of 200 Hz. The sampling frequency is 10 kHz 2....
 1- The signal x(t) is applied to a low pass filter with cutoff frequency equal to 1; write a MATLAB code to find and plot X(f), H(f) and the output of the filter Y(f), where x(t) is given below: x(t) -0.5 0.5 2- Apply the signal x(t) in the previous example to a HPF, BPF and BSF and draw the output signal Y(f). 3- Find and Plot the transfer function of BSF.
Most questions answered within 3 hours.
-
Which of the following pairs of ions have the same electron
configuration?
I: Br− and Se2−...
asked 1 hour ago -
The Foremost Composite Materials Company is planning a two-day
sales conference for October 19-20. The conference...
asked 1 hour ago -
3) Illustrate the observed pattern of relatedness of organisms
versus adaptations to specific conditions. This means...
asked 2 hours ago -
In winter a lake has a 0.35 m thick ice layer over 1.10 m of
water....
asked 3 hours ago -
Assuming the following has been encrypted with a Vigenere cipher
below, use the method(s) and assumptions...
asked 3 hours ago -
How would I use switch statements to write a program that will
take an input of...
asked 3 hours ago -
Imagine a reaction in which methane gas combusts at a constant
pressure of 1 atm and...
asked 3 hours ago -
Two parallel wires (each 12 m in length) are separated by a
distance of 0.065 m...
asked 3 hours ago -
Suppose there were three masses at the corner of uniform
equilateral triangle. The masses are m1...
asked 3 hours ago -
Situation: A building that is 618 m above the ground floor. How
many times would a...
asked 3 hours ago -
help me and discuss one successful and one
unsuccessful international company/busines in Indonesia.whyit
succeed and why...
asked 3 hours ago -
I- Choose the best answer
Which of the following statements about the structure and
packaging of...
asked 3 hours ago