Below is the MATLAB code of low-cut shelving filter which can cut the low frequency of given music signal and low-boost...
Below is the MATLAB code of low-cut shelving filter which can cut the low frequency of given music signal and low-boost shelving filter which can boost the low frequency of given music signal. Design your low-boost shelving filter and low-cut shelving filter to have noticeablly different sound. Compare the sounds of two music signals after filtering, and explain the difference in sounds briefly. If there are any mistakes in code, correct them.
Low-cut shelving filter code:
close all,
clear all,
clc,
ProjectPath = pwd;
MusicSignal_ = strcat(ProjectPath,'\yanny_laurel.wav');
[x, Fs] = audioread(MusicSignal_);
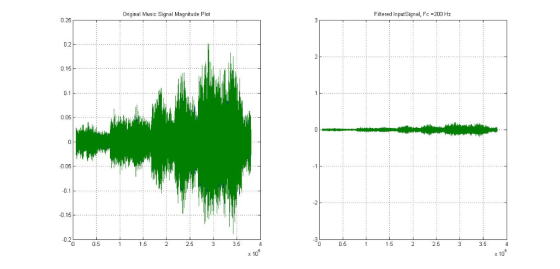
subplot(1,2,1); plot(x);
title('Original Music Signal Magnitude Plot');
%soundsc(y,Fs);
grid on,
Fc=200; %Cut off Freq in Hz
Order=2;
Wn = Fc/(Fs/2);
b = fir1(Order,Wn,'low'); hd = dfilt.dffir(b);
y = filter(hd,x);
subplot(1,2,2); plot(y); grid on, ylim([-3,3]);
str = strcat('Filtered InputSignal, Fc = ',num2str(Fc),' Hz');
title(str);
figure,
freqz(b,1,512);
Low-boost shelving filter:
close all,
clear all,
clc,
ProjectPath = pwd;
MusicSignal_ = strcat(ProjectPath,'\yanny_laurel.wav');
[x, Fs] = audioread(MusicSignal_);
Fc=(200/Fs)/2;
f = fdesign.parameq('F0,BW,BWp,Gref,G0,GBW,Gp,Gst',...
Fc, 0.3, 0.2, 0, 4, 2, 3.5, 0.5);
h = design(f);
hfvt = fvtool(h,'Color','white');
set(hfvt,'Filters',h);
legend(hfvt,'Low-Boost Shelving Filter');
subplot(2,1,1); plot(x);
title('Original yanny_laurel.wav File Plot');
%soundsc(y,Fs);
y = filter(h,x);
subplot(2,1,2); plot(y); grid on, ylim([-3,3]);
str = strcat('Filtered InputSignal, Fc = ',num2str(Fc),' Hz');
title(str);
Homework Answers
Low Boost Filter means Low Pass Filter and Low cut Filter means High Pass Filter.
Therefore, we need to design low pass and high pass filter.
Fc is the cut off frequency in each case.
Below is the matlab code:
%%%%%%%%%%%%%%%%%%%%%%%%%%%%%%%%%%%%%%%%%%%%%%%%%%%%%%%
%LOW PASS FILTER
close all,
clear all,
clc,
ProjectPath = pwd;
MusicSignal_ = strcat(ProjectPath,'\Tone.wav');
Fc=20; %Cut off Freq in Hz
Order=2; %Filter Order
[x, Fs, nbits] = wavread(MusicSignal_);
subplot(1,2,1); plot(x);
title('Original Music Signal Magnitude Plot');
%soundsc(x,Fs);
grid on,
Wn = Fc/(Fs/2);
b = fir1(Order,Wn,'low');
hd = dfilt.dffir(b);
y = filter(hd,x);
subplot(1,2,2); plot(y); grid on, ylim([-3,3]);
str = strcat('Filtered InputSignal, Fc = ',num2str(Fc),' Hz');
title(str);
figure,
freqz(b,1,512);
title('Low Pass Filter');
%HIGH PASS FILTER
figure,
close all,
clear all,
clc,
ProjectPath = pwd;
MusicSignal_ = strcat(ProjectPath,'\Tone.wav');
Fc=200; %Cut off Freq in Hz
Order=2; %Filter Order
[x, Fs, nbits] = wavread(MusicSignal_);
subplot(1,2,1); plot(x);
title('Original Music Signal Magnitude Plot');
%soundsc(x,Fs);
grid on,
Wn = Fc/(Fs/2);
b = fir1(Order,Wn,'high');
hd = dfilt.dffir(b);
y = filter(hd,x);
subplot(1,2,2); plot(y); grid on, ylim([-3,3]);
str = strcat('Filtered InputSignal, Fc = ',num2str(Fc),' Hz');
title(str);
figure,
freqz(b,1,512);
title('High Pass Filter');
%%%%%%%%%%%%%%%%%%%%%%%%%%%%%%%%%%%%%%%%%%%%%%%%%%%%%%%


Add Answer to:
Below is the MATLAB code of low-cut shelving filter which can cut the low frequency of given music signal and low-boost...
MATLAB. Design your own low-pass shelving filter which can boost the low frequency of given music signal. After designin...
MATLAB. Design your own low-pass shelving filter which can boost the low frequency of given music signal. After designing filter, apply the filter to the original music signal and observe the result. Include following plots. A. Magnitude and phase plot of your filter. B. Magnitude plot of original signal C. Magnitude plot of filtered signal
MATLAB. Design your own low-cut shelving filter which can cut the low frequency of given music signal. Include magnitude...
MATLAB. Design your own low-cut shelving filter which can cut the low frequency of given music signal. Include magnitude and phase plot of your filter.
ON MATLAB: ii. Using FIR low-pass filter, remove signal S2, considering fc = 20 Hz as a...
ON MATLAB: ii. Using FIR low-pass filter, remove signal S2, considering fc = 20 Hz as a cut-off frequency and consider two sets of filter coefficients: 11 and 301. Plot the time and frequency domain of the filtered signal, and comment. the process x(n) is sum of two signals S1 and S2; mathematically be described as: ?(?) = ?1 + ?2 where ?1 = ?1cos(2??1??? ) and ?2 = ?2cos(2??2??? ), A1 = A2 = 1; f1 = 10Hz; f2 =...
Using filterDesigner in MATLAB, design a second order low pass IIR Butterworth filter whose sampling frequency...
Using filterDesigner in MATLAB, design a second order low pass IIR Butterworth filter whose sampling frequency (Fs) is 1 kHz and cutoff frequency (Fc) is 10 Hz. Find the numerator and denominator coefficients. Write its transfer function H(z) = Y(z) / X(z). Write its difference function y(k). Draw (copy from Filter Designer) the magnitude response plot. Draw (copy from Filter Designer) the phase response plot. Draw (copy from Filter Designer) the impulse response plot.
Using filterDesigner in MATLAB, design a second order low pass IIR Butterworth filter whose sampling frequency (Fs) is 1...
Using filterDesigner in MATLAB, design a second order low pass IIR Butterworth filter whose sampling frequency (Fs) is 1 kHz and cutoff frequency (Fc) is 10 Hz. Find the numerator and denominator coefficients. Write its transfer function H(z) = Y(z) / X(z). Write its difference function y(k). Draw (copy from Filter Designer) the magnitude response plot. Draw (copy from Filter Designer) the phase response plot. Draw (copy from Filter Designer) the impulse response plot.
NB! This task is required to be solved in matlab. this task also requires the use...
 NB! This task is required to be solved in matlab. this task also requires the use of the function displayDualSpectrum();
which i have pasted in the bottom. the tasks that i need help with are A), B) and C). this is a multi-part question.
Task - Frequency mixing
We use a basic signal that can be described mathematically as follows:
with this We shall then make an amplitude modulated signal: where fc is the carrier frequency. the code below specifies...
NB! This task is required to be solved in matlab. this task also requires the use of the function displayDualSpectrum();
which i have pasted in the bottom. the tasks that i need help with are A), B) and C). this is a multi-part question.
Task - Frequency mixing
We use a basic signal that can be described mathematically as follows:
with this We shall then make an amplitude modulated signal: where fc is the carrier frequency. the code below specifies...
[MATLAB Scriptfile task] Design N-band tone vocoder with a given figure (below) in MATLAB implementing the...
 [MATLAB Scriptfile task]
Design N-band tone vocoder with a given figure (below) in MATLAB
implementing the given script file(bands_cutoff). This program
should be able to process any sound(.wav) file. Then, graph the
band-passed signals and amplitude envelopes extracted(after
rectification and low-pass filtering) and waveforms of the original
sound and vocoded sound. Additionally, using the output of the
script file, make spectrograms of the original sound and the
synthesized sound.
Bandpass filter Modulation Band-limiting Envelope detection BPF RECT LPF BPF sine...
[MATLAB Scriptfile task]
Design N-band tone vocoder with a given figure (below) in MATLAB
implementing the given script file(bands_cutoff). This program
should be able to process any sound(.wav) file. Then, graph the
band-passed signals and amplitude envelopes extracted(after
rectification and low-pass filtering) and waveforms of the original
sound and vocoded sound. Additionally, using the output of the
script file, make spectrograms of the original sound and the
synthesized sound.
Bandpass filter Modulation Band-limiting Envelope detection BPF RECT LPF BPF sine...
 NB! This task is required to be solved in matlab. this task also requires the use of the function displayDualSpectrum();
which i have pasted in the bottom. the tasks that i need help with are A), B) and C). this is a multi-part question.
Task - Frequency mixing
We use a basic signal that can be described mathematically as follows:
with this We shall then make an amplitude modulated signal: where fc is the carrier frequency. the code below specifies...
NB! This task is required to be solved in matlab. this task also requires the use of the function displayDualSpectrum();
which i have pasted in the bottom. the tasks that i need help with are A), B) and C). this is a multi-part question.
Task - Frequency mixing
We use a basic signal that can be described mathematically as follows:
with this We shall then make an amplitude modulated signal: where fc is the carrier frequency. the code below specifies...
 [MATLAB Scriptfile task]
Design N-band tone vocoder with a given figure (below) in MATLAB
implementing the given script file(bands_cutoff). This program
should be able to process any sound(.wav) file. Then, graph the
band-passed signals and amplitude envelopes extracted(after
rectification and low-pass filtering) and waveforms of the original
sound and vocoded sound. Additionally, using the output of the
script file, make spectrograms of the original sound and the
synthesized sound.
Bandpass filter Modulation Band-limiting Envelope detection BPF RECT LPF BPF sine...
[MATLAB Scriptfile task]
Design N-band tone vocoder with a given figure (below) in MATLAB
implementing the given script file(bands_cutoff). This program
should be able to process any sound(.wav) file. Then, graph the
band-passed signals and amplitude envelopes extracted(after
rectification and low-pass filtering) and waveforms of the original
sound and vocoded sound. Additionally, using the output of the
script file, make spectrograms of the original sound and the
synthesized sound.
Bandpass filter Modulation Band-limiting Envelope detection BPF RECT LPF BPF sine...
Most questions answered within 3 hours.
-
You have to write your code in C++ (as a cpp file) and prepare a
docx...
asked 48 minutes ago -
Why does the spectrum of bromocresol green changes at different
pHs? What causes the change?
asked 53 minutes ago -
Rice Company has a unit selling price of $690, variable costs
per unit of $390, and...
asked 1 hour ago -
The DeVille Company reported pretax accounting
income on its income statement as follows:
2018
$
425,000...
asked 1 hour ago -
Argue for or against the "Three Strikes"laws. Provide a rationale
to support your response.
asked 2 hours ago -
Bargaining Models: what is the "Obsolescing Bargain"?
Bargaining Models: what are the factors that would tend...
asked 3 hours ago -
1. A ball is thrown up into the air.
a) Draw motion diagram and the point-like...
asked 3 hours ago -
1) Because money eliminates the "double coincidence of wants"
problem, the development of money as a...
asked 4 hours ago -
Company AAA produces only one product which other manufacturers
purchase as a component for their final...
asked 6 hours ago -
An
item can be appended to an array-based list, provided the lenght is
less than the...
asked 6 hours ago -
Two particles each have a rest mass energy of 30 MeV and are
traveling with a...
asked 8 hours ago -
why
is vectorization a faster alternative to loops?
asked 9 hours ago