
Homework Answers

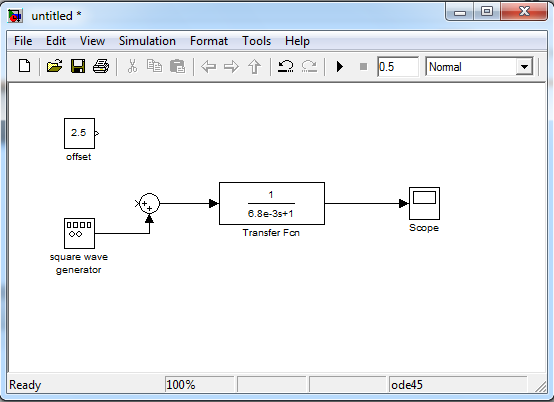
Simulation in SIMULINK is given below. block diagram is given below.

the response Vout(t) for square wave input is given below.

Now simulation without offset.
Simulation result:

Now change the frequency to 200 Hz.

Simulation result:

signal filtering:
simulation block diagram

simulation result:

from the above figure, it is observed that the noisy signal (yellow color) is fitered and the output signal (pink color) is free of noise.
Add Answer to:
Prelab Preparation: For the RC circuit shown in Figure 1, derive the modeling equation relating the output volta ge...
1. Use MultiSim program to simulate the RC circuit shown in Figures 1 using nominal resistor valu...
 1. Use MultiSim program to simulate the RC circuit shown in Figures 1 using nominal resistor value of 100Ω and 10uF capacitor. Set up the function generator for: square wave, frequency 20Hz, duty cycle 50%, offset 1V, and amplitude 1V. Use Tektronix scope to display the input source and the capacitor voltage waveforms on the same display 2. Print out your schematics and print an output showing Channels A and B 3. Use the scope cursors to measure simulated t...
part II is what I need help one. part 1 is also attached for your reference...
 part II is what I need help one. part 1 is also
attached for your reference
Part II: Low Pass Filter contd. Noise Removal To observe the noise removal capabilities of a low -pass filter, we will add a second input to the system to simulate noise Step 1: Alter your Simulink model by adding another sine wave function and use a Sum block to add the inputs together as the new input to the system. The second sine function...
part II is what I need help one. part 1 is also
attached for your reference
Part II: Low Pass Filter contd. Noise Removal To observe the noise removal capabilities of a low -pass filter, we will add a second input to the system to simulate noise Step 1: Alter your Simulink model by adding another sine wave function and use a Sum block to add the inputs together as the new input to the system. The second sine function...
Will thumbs up. Thank you. Use Simulink to simulate the behavior of the difference equation y[n] x[n] (1/4)y[n-. Use a s...
 Will thumbs up. Thank you.
Use Simulink to simulate the behavior of the difference equation y[n] x[n] (1/4)y[n-. Use a sine wave as the input x[n]. Decide upon a frequency and sample time of your choice. Use the following Simulink blocks to build the Simulink model of the system as shown in Figure 13: an Integer Delay block from the Discrete library 14 a Gain block from the Math Operations library (double click the block to specify the gain parameter...
Will thumbs up. Thank you.
Use Simulink to simulate the behavior of the difference equation y[n] x[n] (1/4)y[n-. Use a sine wave as the input x[n]. Decide upon a frequency and sample time of your choice. Use the following Simulink blocks to build the Simulink model of the system as shown in Figure 13: an Integer Delay block from the Discrete library 14 a Gain block from the Math Operations library (double click the block to specify the gain parameter...
IV, Laboratory Procedure 1. Construct the circuit of Figure 6.1, measure the current value 2. Con...
 IV, Laboratory Procedure 1. Construct the circuit of Figure 6.1, measure the current value 2. Construct the circuit of Figure 6.2; measure Vn and v., using the oscilloscope. 3. Construct the circuit of Figure 6.3, measure the value of Io and V 4. Construct the clipper design circuit, Capture the input and output waveforms. 5. Construct your clamper design circuit. Capture the input and output waveforms Figure 6.3 Design a clipper circuit which limits input signals to +3V and -2V....
Q.2 ICO2]10 Marks] The signal g(t) forms the input to the LPF circuit shown in the figure, where R l,and y(Dis the output. If the power spectral density (PSD) of the signal ge) is (a) The autoc...
 Q.2 ICO2]10 Marks] The signal g(t) forms the input to the LPF circuit shown in the figure, where R l,and y(Dis the output. If the power spectral density (PSD) of the signal ge) is (a) The autocorrelation of g(t) (b) The 3-dB bandwidth of the LPF (c) The power of g(t) and y(t) (d) Based on your answers above, will it be better if the signal has more or less bandwith? (e) If a white noise of PSD No/2 is...
You are taking a measurement of a signal from a sensor with high frequency noise. In...
You are taking a measurement of a signal from a sensor with high frequency noise. In order to not amplify that noise through your instrumentation system, you decide to use a RC filter with a cutoff frequency (critical frequency, fc) of 1kHz after the sensor and before the amplification. What kind of RC filter do you need? Design the RC filter. Be sure to use standard resistor and capacitor values and specify the tolerance. Show all work. Construct the circuit...
F LOpoint For the circuit shown in Figure 3 3. 1. Draw the DC equivalent circuit...
 F LOpoint For the circuit shown in Figure 3 3. 1. Draw the DC equivalent circuit by opening caps and shorting inductors 2. Analyze the DC equivalent circuit as we have in previous labs (assume a region, analyze and check assumptions). Check your DC operating point using LT Spice. 3. Calculate the small signal parameters (transconductance, output resistance, input resistance) 4. Draw the AC equivalent circuit by shorting de voltage sources, opening dc current sources, shorting caps and opening inductors....
You can use any software of your choice Begin by connecting the waveform generator to the...
 You can use any software of your choice
Begin by connecting the waveform generator to the series combination of a 0.2uF capacitor (use a decade capacitor box) and a 1 ks resistor (use a decade resistor box). Generate a 500 Hz, 8 Vp- p square wave with a 4 Volt offset and observe this waveform on the oscilloscope's Channel 1. Monitor the voltage drop across the capacitor on Channel 2. Figure 1 shows the schematic for the RC circuit 1k...
You can use any software of your choice
Begin by connecting the waveform generator to the series combination of a 0.2uF capacitor (use a decade capacitor box) and a 1 ks resistor (use a decade resistor box). Generate a 500 Hz, 8 Vp- p square wave with a 4 Volt offset and observe this waveform on the oscilloscope's Channel 1. Monitor the voltage drop across the capacitor on Channel 2. Figure 1 shows the schematic for the RC circuit 1k...
1. Find the transfer function Voda)/Vin(a) for the circuit shown in Figure 1 of the lab (where co...
 Please answer number 1
1. Find the transfer function Voda)/Vin(a) for the circuit shown in Figure 1 of the lab (where complex frequency variable s jo can be substituted for ease of analysis.) Calculate values for R and C such that the phase shift between the output and input is zero for an input frequency of 10kHz. What is the amplitude ratio (gain) of the output to the input at this frequency. 2. The RC network in figure 3 of...
Please answer number 1
1. Find the transfer function Voda)/Vin(a) for the circuit shown in Figure 1 of the lab (where complex frequency variable s jo can be substituted for ease of analysis.) Calculate values for R and C such that the phase shift between the output and input is zero for an input frequency of 10kHz. What is the amplitude ratio (gain) of the output to the input at this frequency. 2. The RC network in figure 3 of...
Laboratory 1: operation amplifier characteristics A. Objectives: 1. To study the basic characteri...
 thanks
Laboratory 1: operation amplifier characteristics A. Objectives: 1. To study the basic characteristics of an operational amplifier 2. To study the bias circuit of an operational amplifier B. Apparatus: 1. DC Power supply 2. Experimental board and corresponding components 3. Electronic calculator (prepared by students) 4. Digital camera (prepared by students for photo taking of the experimental results) 5. Laptop computer with the software PicoScope 6 and Microsoft Word installed. 6. PicoScope PC Oscilloscope and its accessories. 7. Multimeter...
thanks
Laboratory 1: operation amplifier characteristics A. Objectives: 1. To study the basic characteristics of an operational amplifier 2. To study the bias circuit of an operational amplifier B. Apparatus: 1. DC Power supply 2. Experimental board and corresponding components 3. Electronic calculator (prepared by students) 4. Digital camera (prepared by students for photo taking of the experimental results) 5. Laptop computer with the software PicoScope 6 and Microsoft Word installed. 6. PicoScope PC Oscilloscope and its accessories. 7. Multimeter...
 1. Use MultiSim program to simulate the RC circuit shown in Figures 1 using nominal resistor value of 100Ω and 10uF capacitor. Set up the function generator for: square wave, frequency 20Hz, duty cycle 50%, offset 1V, and amplitude 1V. Use Tektronix scope to display the input source and the capacitor voltage waveforms on the same display 2. Print out your schematics and print an output showing Channels A and B 3. Use the scope cursors to measure simulated t...
 part II is what I need help one. part 1 is also
attached for your reference
Part II: Low Pass Filter contd. Noise Removal To observe the noise removal capabilities of a low -pass filter, we will add a second input to the system to simulate noise Step 1: Alter your Simulink model by adding another sine wave function and use a Sum block to add the inputs together as the new input to the system. The second sine function...
part II is what I need help one. part 1 is also
attached for your reference
Part II: Low Pass Filter contd. Noise Removal To observe the noise removal capabilities of a low -pass filter, we will add a second input to the system to simulate noise Step 1: Alter your Simulink model by adding another sine wave function and use a Sum block to add the inputs together as the new input to the system. The second sine function...
 Will thumbs up. Thank you.
Use Simulink to simulate the behavior of the difference equation y[n] x[n] (1/4)y[n-. Use a sine wave as the input x[n]. Decide upon a frequency and sample time of your choice. Use the following Simulink blocks to build the Simulink model of the system as shown in Figure 13: an Integer Delay block from the Discrete library 14 a Gain block from the Math Operations library (double click the block to specify the gain parameter...
Will thumbs up. Thank you.
Use Simulink to simulate the behavior of the difference equation y[n] x[n] (1/4)y[n-. Use a sine wave as the input x[n]. Decide upon a frequency and sample time of your choice. Use the following Simulink blocks to build the Simulink model of the system as shown in Figure 13: an Integer Delay block from the Discrete library 14 a Gain block from the Math Operations library (double click the block to specify the gain parameter...
 IV, Laboratory Procedure 1. Construct the circuit of Figure 6.1, measure the current value 2. Construct the circuit of Figure 6.2; measure Vn and v., using the oscilloscope. 3. Construct the circuit of Figure 6.3, measure the value of Io and V 4. Construct the clipper design circuit, Capture the input and output waveforms. 5. Construct your clamper design circuit. Capture the input and output waveforms Figure 6.3 Design a clipper circuit which limits input signals to +3V and -2V....
 Q.2 ICO2]10 Marks] The signal g(t) forms the input to the LPF circuit shown in the figure, where R l,and y(Dis the output. If the power spectral density (PSD) of the signal ge) is (a) The autocorrelation of g(t) (b) The 3-dB bandwidth of the LPF (c) The power of g(t) and y(t) (d) Based on your answers above, will it be better if the signal has more or less bandwith? (e) If a white noise of PSD No/2 is...
 F LOpoint For the circuit shown in Figure 3 3. 1. Draw the DC equivalent circuit by opening caps and shorting inductors 2. Analyze the DC equivalent circuit as we have in previous labs (assume a region, analyze and check assumptions). Check your DC operating point using LT Spice. 3. Calculate the small signal parameters (transconductance, output resistance, input resistance) 4. Draw the AC equivalent circuit by shorting de voltage sources, opening dc current sources, shorting caps and opening inductors....
 You can use any software of your choice
Begin by connecting the waveform generator to the series combination of a 0.2uF capacitor (use a decade capacitor box) and a 1 ks resistor (use a decade resistor box). Generate a 500 Hz, 8 Vp- p square wave with a 4 Volt offset and observe this waveform on the oscilloscope's Channel 1. Monitor the voltage drop across the capacitor on Channel 2. Figure 1 shows the schematic for the RC circuit 1k...
You can use any software of your choice
Begin by connecting the waveform generator to the series combination of a 0.2uF capacitor (use a decade capacitor box) and a 1 ks resistor (use a decade resistor box). Generate a 500 Hz, 8 Vp- p square wave with a 4 Volt offset and observe this waveform on the oscilloscope's Channel 1. Monitor the voltage drop across the capacitor on Channel 2. Figure 1 shows the schematic for the RC circuit 1k...
 Please answer number 1
1. Find the transfer function Voda)/Vin(a) for the circuit shown in Figure 1 of the lab (where complex frequency variable s jo can be substituted for ease of analysis.) Calculate values for R and C such that the phase shift between the output and input is zero for an input frequency of 10kHz. What is the amplitude ratio (gain) of the output to the input at this frequency. 2. The RC network in figure 3 of...
Please answer number 1
1. Find the transfer function Voda)/Vin(a) for the circuit shown in Figure 1 of the lab (where complex frequency variable s jo can be substituted for ease of analysis.) Calculate values for R and C such that the phase shift between the output and input is zero for an input frequency of 10kHz. What is the amplitude ratio (gain) of the output to the input at this frequency. 2. The RC network in figure 3 of...
 thanks
Laboratory 1: operation amplifier characteristics A. Objectives: 1. To study the basic characteristics of an operational amplifier 2. To study the bias circuit of an operational amplifier B. Apparatus: 1. DC Power supply 2. Experimental board and corresponding components 3. Electronic calculator (prepared by students) 4. Digital camera (prepared by students for photo taking of the experimental results) 5. Laptop computer with the software PicoScope 6 and Microsoft Word installed. 6. PicoScope PC Oscilloscope and its accessories. 7. Multimeter...
thanks
Laboratory 1: operation amplifier characteristics A. Objectives: 1. To study the basic characteristics of an operational amplifier 2. To study the bias circuit of an operational amplifier B. Apparatus: 1. DC Power supply 2. Experimental board and corresponding components 3. Electronic calculator (prepared by students) 4. Digital camera (prepared by students for photo taking of the experimental results) 5. Laptop computer with the software PicoScope 6 and Microsoft Word installed. 6. PicoScope PC Oscilloscope and its accessories. 7. Multimeter...
Most questions answered within 3 hours.
-
You are the captain of an old-timey warship with 10 cannons. It
takes 4 hits to...
asked 10 minutes ago -
Thanks to programming experience and language evolution, we have
a rather easy fix to this problem....
asked 18 minutes ago -
A random sample of 8 size AA batteries for toys yielded a mean
lifespan of 3.65...
asked 37 minutes ago -
What do Keynesian economists think will happen when GDP is low,
with regard to firms' expenses...
asked 28 minutes ago -
Q: An airport official wants to demonstrate that the P1 =
proportion of delayed flights after...
asked 36 minutes ago -
To calculate the adjusted present value, one will:
divide the project's cash flow by the risk-adjusted...
asked 38 minutes ago -
All in C please~
#1 Consider this program:
#include <stdio.h>
int main () { /* main...
asked 1 hour ago -
How is Lasik Method useful to measure the respiration rate of
plants?
asked 1 hour ago -
A laser emits a cylindrical beam of light 2.6 mm in diameter. If
the average power...
asked 54 minutes ago -
Questions:
How do we experience pain?
3 ways how pain affect quality of life?
The best...
asked 57 minutes ago -
If GDP is currently $300 and the growth rate is 5 percent, how
many years will...
asked 1 hour ago -
The number of claims for lost luggage in a small city airport
averages 8 per day....
asked 1 hour ago