
Homework Answers
| Class | Frequency | Cumulative Frequency |
| 321-360 | 3 | 3 |
| 361-400 | 2 | 5 |
| 401-440 | 5 | 10 |
| 441-480 | 3 | 13 |
| 481-520 | 0 | 13 |
| 521-560 | 5 | 18 |
| 561-600 | 8 | 26 |
| 601-640 | 3 | 29 |
| 641-680 | 2 | 31 |
| 681-720 | 14 | 45 |
| 721-760 | 2 | 47 |
| 761-800 | 2 | 49 |
| Total | 49 |
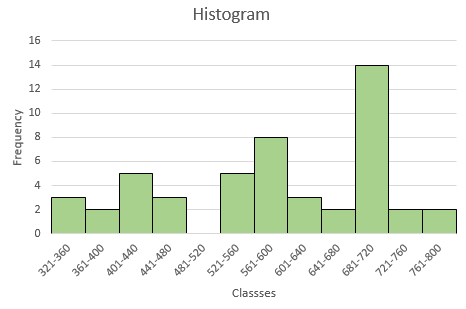
To piece of information that are used to make ogive are upper class limit of the data and cumulative frequency.

Add Answer to:
Name Histogram/Ogive Follow. SAT Scores Data: 800 780 760740720 700 700 700 700 690 690 690...
Next SIX questions are related to the following data: The following is a random sample of...
Next SIX questions are related to the following data: The following is a random sample of n = 90 undergraduate students' annual textbook expense. 610 600 300 420 520 470 430 520 400 370 730 480 450 500 650 370 540 330 690 550 450 450 750 750 660 700 300 770 760 390 680 450 590 630 530 700 580 390 330 320 350 490 310 320 780 590 370 470 760 550 630 450 640 620 520 440...
The following is a random sample of n = 90 undergraduate students' annual textbook expense. 610...
The following is a random sample of n = 90 undergraduate students' annual textbook expense. 610 600 300 420 520 470 430 520 400 370 730 480 450 500 650 370 540 330 690 550 450 450 750 750 660 700 300 770 760 390 680 450 590 630 530 700 580 390 330 320 350 490 310 320 780 590 370 470 760 550 630 450 640 620 520 440 720 660 440 770 380 450 800 720 370...
I just need help with questions 5 and 6 370 300 630 530 Next SIX questions...
 I just need help with questions 5 and 6
370 300 630 530 Next SIX questions are related to the following data: The following is a random sample of n = 90 undergraduate students' annual textbook expense. 610 600 300 420 520 470 430 520 400 370 730 480 450 500 650 540 330 690 550 450 450 750 750 660 700 770 760 390 680 590 700 580 390 330 320 350 490 310 320 780 370 760 630...
I just need help with questions 5 and 6
370 300 630 530 Next SIX questions are related to the following data: The following is a random sample of n = 90 undergraduate students' annual textbook expense. 610 600 300 420 520 470 430 520 400 370 730 480 450 500 650 540 330 690 550 450 450 750 750 660 700 770 760 390 680 590 700 580 390 330 320 350 490 310 320 780 370 760 630...
Forecasting method
 Use the moving average method to forecast period 105.Use the exponential smoothing method to forecast period 105.Use the time-series decomposition method to forecast period 105.Comparing the three methods, which one fits this situation best?The larger the parameter (n) is set, the more historical data are taken into account by the moving average.You can choose different parameter (n) to extrapolate to compare the prediction effect.In general, the parameter (n) should not be taken too large.Moving average.153025703560453055106560761085609580106101165012700136701470015760167301776018820197802090021840227702382024800257602676027770287902976030740317203267033690344703567036690376203865039610406204164042590436104460045630466004763048640496105059051610526305366054640558105679057820586505971060700616706269063730647306576066790678106887069890708707189072880739307498075900768607789078880798708084081860829108387084860858408654087780887508978090760917109273093750947509571096750977209877099740100750101760102780103800104850105Exponential smoothingsame153025703560453055106560761085609580106101165012700136701470015760167301776018820197802090021840227702382024800257602676027770287902976030740317203267033690344703567036690376203865039610406204164042590436104460045630466004763048640496105059051610526305366054640558105679057820586505971060700616706269063730647306576066790678106887069890708707189072880739307498075900768607789078880798708084081860829108387084860858408654087780887508978090760917109273093750947509571096750977209877099740100750101760102780103800104850105Time-series decomposition153025703560453055106560761085609580106101165012700136701470015760167301776018820197802090021840227702382024800257602676027770287902976030740317203267033690344703567036690376203865039610406204164042590436104460045630466004763048640496105059051610526305366054640558105679057820586505971060700616706269063730647306576066790678106887069890708707189072880739307498075900768607789078880798708084081860829108387084860858408654087780887508978090760917109273093750947509571096750977209877099740100750101760102780103800104850105
You will start by considering the data set in the proj2-2.txt file on BlackBoard. The data set contains SEX (1=female; 2=male), PEFR in l/min and height in cm. 1. Make a scatter plot of PEFR versus...
You will start by considering the data set in the proj2-2.txt file on BlackBoard. The data set contains SEX (1=female; 2=male), PEFR in l/min and height in cm. 1. Make a scatter plot of PEFR versus height. 2. Fit the simple linear regression of PEFR on height. 3. What is the estimated slope (with CI) and the interpretation of this estimate. 4. What is the standard deviation around the line (with CI) and the interpretation of this estimate. 5. Estimate...
The cantilevered bar in the figure is made from a ductile material and is statically loaded...
 The cantilevered bar in the figure is made from a ductile material and is statically loaded with Fx-320 lbf, Fy = 255 lbf, and F- 105 lbf. The critical stress element experiences = 58.4 kpsi, σ x ,axial =0.407 kpsi and τ = 15.6 kpsi. Determine the minimum factor of safety for fatigue at point A, based on infinite life. If the life is not infinite, estimate the number of cycles. The force F is applied as a repeated load...
Tendai is a welder who started his own business making security gates, fences and other related steel product . Unit of...
Tendai is a welder who started his own business making security gates, fences and other related steel product . Unit of capital employed Unit of Capital employed Output quantity (Q) 10 340 560 800 1 000 1 160 1 380 1 650 1 950 1 980 2 200 9 400 620 840 1 030 1 210 1 440 1 770 2 000 2 050 2 100 8 380 540 810 980 1 090 1 400 1 700 1 980 2...
Tendai is a welder who started his own business making security gates, fences and other related...
Tendai is a welder who started his own business making security gates, fences and other related steel product . Unit of capital employed Unit of Capital employed Output quantity (Q) 10 340 560 800 1 000 1 160 1 380 1 650 1 950 1 980 2 200 9 400 620 840 1 030 1 210 1 440 1 770 2 000 2 050 2 100 8 380 540 810 980 1 090 1 400 1 700 1 980...
Who Watches More TV: Males or Females? Use technology and the StudentSurvey dataset to test whether...
 Who Watches More TV: Males or Females? Use technology and the StudentSurvey dataset to test whether the data provide evidence that there is a difference in the mean number of hours spent watching television per week between males and females. Click here for the dataset associated with this question. What are the hypotheses? Use subscripts 1 for females and 2 for males. 11 1 H HP UP HP HIP 11 12 11 Pi 1: P2 G TV Piercing B Gender...
In C++ Programming: Using a single for loop, output the even numbers between 2 and 1004...
In C++ Programming: Using a single for loop, output the even numbers between 2 and 1004 (inclusive) that iterates (loops) exactly 502 times. The outputted numbers be aligned in a table with 10 numbers per row. Each column in the table should be 5 characters wide. Do not nest a loop inside of another loop. Hint: First create and test the code that output the numbers all on one line (the command line will automatically wrap the output to new...
 I just need help with questions 5 and 6
370 300 630 530 Next SIX questions are related to the following data: The following is a random sample of n = 90 undergraduate students' annual textbook expense. 610 600 300 420 520 470 430 520 400 370 730 480 450 500 650 540 330 690 550 450 450 750 750 660 700 770 760 390 680 590 700 580 390 330 320 350 490 310 320 780 370 760 630...
I just need help with questions 5 and 6
370 300 630 530 Next SIX questions are related to the following data: The following is a random sample of n = 90 undergraduate students' annual textbook expense. 610 600 300 420 520 470 430 520 400 370 730 480 450 500 650 540 330 690 550 450 450 750 750 660 700 770 760 390 680 590 700 580 390 330 320 350 490 310 320 780 370 760 630...
 Use the moving average method to forecast period 105.Use the exponential smoothing method to forecast period 105.Use the time-series decomposition method to forecast period 105.Comparing the three methods, which one fits this situation best?The larger the parameter (n) is set, the more historical data are taken into account by the moving average.You can choose different parameter (n) to extrapolate to compare the prediction effect.In general, the parameter (n) should not be taken too large.Moving average.153025703560453055106560761085609580106101165012700136701470015760167301776018820197802090021840227702382024800257602676027770287902976030740317203267033690344703567036690376203865039610406204164042590436104460045630466004763048640496105059051610526305366054640558105679057820586505971060700616706269063730647306576066790678106887069890708707189072880739307498075900768607789078880798708084081860829108387084860858408654087780887508978090760917109273093750947509571096750977209877099740100750101760102780103800104850105Exponential smoothingsame153025703560453055106560761085609580106101165012700136701470015760167301776018820197802090021840227702382024800257602676027770287902976030740317203267033690344703567036690376203865039610406204164042590436104460045630466004763048640496105059051610526305366054640558105679057820586505971060700616706269063730647306576066790678106887069890708707189072880739307498075900768607789078880798708084081860829108387084860858408654087780887508978090760917109273093750947509571096750977209877099740100750101760102780103800104850105Time-series decomposition153025703560453055106560761085609580106101165012700136701470015760167301776018820197802090021840227702382024800257602676027770287902976030740317203267033690344703567036690376203865039610406204164042590436104460045630466004763048640496105059051610526305366054640558105679057820586505971060700616706269063730647306576066790678106887069890708707189072880739307498075900768607789078880798708084081860829108387084860858408654087780887508978090760917109273093750947509571096750977209877099740100750101760102780103800104850105
 The cantilevered bar in the figure is made from a ductile material and is statically loaded with Fx-320 lbf, Fy = 255 lbf, and F- 105 lbf. The critical stress element experiences = 58.4 kpsi, σ x ,axial =0.407 kpsi and τ = 15.6 kpsi. Determine the minimum factor of safety for fatigue at point A, based on infinite life. If the life is not infinite, estimate the number of cycles. The force F is applied as a repeated load...
 Who Watches More TV: Males or Females? Use technology and the StudentSurvey dataset to test whether the data provide evidence that there is a difference in the mean number of hours spent watching television per week between males and females. Click here for the dataset associated with this question. What are the hypotheses? Use subscripts 1 for females and 2 for males. 11 1 H HP UP HP HIP 11 12 11 Pi 1: P2 G TV Piercing B Gender...
Most questions answered within 3 hours.
-
Rod figures that it takes an average (mean) of =20 minutes with
a standard deviation of...
asked 11 minutes ago -
You have 5 ul of a pure (undiluted) culture at a concentration
of 3.6 x 10⁶...
asked 16 minutes ago -
______ activity indicates the presence of an electron transport
chain.
1- gelatinase 2- oxidase 3- caseinase...
asked 18 minutes ago -
The molarity of a silver nitrate solution is 0.192 M. How many
grams of silver ions...
asked 31 minutes ago -
Which of the following solutes will produce a greater increase
in boiling point when it is...
asked 27 minutes ago -
true or false: Series connected electrical circuit is a voltage
divider, and voltage of each device...
asked 22 minutes ago -
A 100-W lightbulb has a resistance of about 12 Ω when cold (20
∘C) and 128...
asked 26 minutes ago -
For the asset shown in the following table, use the capital
asset pricing model to find...
asked 27 minutes ago -
If the impulse response of a circuit is a pulse y(t) = u(t) –
u(t-T), T...
asked 34 minutes ago -
Eukaryotic cells have __ which is similar to prokaryotes of
Archaea.
A Ester-linked membrane lipids
B...
asked 43 minutes ago -
true or false. If work is done on a system by it's
surroundings, its value is...
asked 48 minutes ago -
Rene Descartes establishes a dualist approach to the world.
Explain this dualism, and how it connects...
asked 54 minutes ago