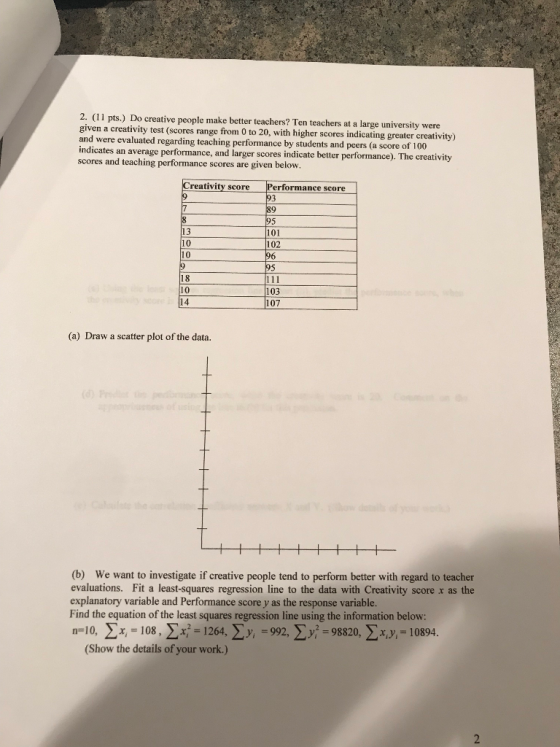
2. (11 pts.) Do creative people make better teachers? Ten teachers at a large university were given a creativity test (scores range from 0 to 20, with higher scores indicating greater creativity) and were evaluated regarding teaching performance by students and peers (a score of 100 indicates an average performance, and larger scores indicate better performance). The creativity scores and teaching performance scores are given below.
|
Creativity score |
Performance score |
|
9 |
93 |
|
7 |
89 |
|
8 |
95 |
|
13 |
101 |
|
10 |
102 |
|
10 |
96 |
|
9 |
95 |
|
18 |
111 |
|
10 |
103 |
|
14 |
107 |

Please answer all the parts clearly. thank you.
Homework Answers
Please don't hesitate to give a "thumbs up" in case you're satisfied with the answer.
Here' the answer below, with the diagram, formula for correlation, and Rsquare and also the comments on whether values of X will have a good prediction.

Add Answer to:
2. (11 pts.) Do creative people make better teachers? Ten
teachers at a large university were...
WBWK7-Sects7.8and8.1-8.4: Problem 6 Prev Up Next 2 pts) Ten randomly selected people took an lQ test...
 WBWK7-Sects7.8and8.1-8.4: Problem 6 Prev Up Next 2 pts) Ten randomly selected people took an lQ test A, and next day they took a very similar IQ test B. Their scores are shown in the table below. Person 12 345 67 8 9 10 Test A 93 104 100 103 90 108 123 82 74 114 Test B 196 108 102 108 87 107 1228172 119 1. Consider (Test A - Test B). Use a 0.01 significance level to test the...
The bullsh sentment of individual investors was 27.6% AAr Ja mal, measures were based on a...
 The bullsh sentment of individual investors was 27.6% AAr Ja mal, measures were based on a poll conducted by the American Association of Individual Investors. Assume that each bulish sentiment measure was based on a sample of 240 investors a. Develop a 95% conf dence interval for the dmerence between the bullish sentinert measures for the rost recent two weeks (to 3 de deals) February 2009). The bullsh sentment was reported to be 48.7% one week earier and 39.7% one...
Suppose IQ scores were obtained from randomly selected siblings. For 20 such pairs of people, the...
 Suppose IQ scores were obtained from randomly selected siblings. For 20 such pairs of people, the linear correlation coefficient is 0.916 and the equation of the regression line is ý = - 3.14 +1.02x, where x represents the IQ score of the younger child. Also, the 20 x values have a mean of 103.21 and the 20 y values have a mean of 102.1. What is the best predicted IQ of the older child, given that the younger child has...
URGENT PLEASE HELP! The director of a training program for a large insurance company has the business objective of determining which training method is best for training underwriters. The three method...
 URGENT PLEASE HELP!
The director of a training program for a large insurance company
has the business objective of determining which training method is
best for training underwriters. The three methods to be evaluated
are classroom, online, and courseware app. The 30 trainees are
divided into three randomly assigned groups of 10. Before the start
of the training, each trainee is given a proficiency exam that
measures mathematics and computer skills. At the end of the
training, all students take...
URGENT PLEASE HELP!
The director of a training program for a large insurance company
has the business objective of determining which training method is
best for training underwriters. The three methods to be evaluated
are classroom, online, and courseware app. The 30 trainees are
divided into three randomly assigned groups of 10. Before the start
of the training, each trainee is given a proficiency exam that
measures mathematics and computer skills. At the end of the
training, all students take...
The data from data421.dat contains information on 78 seventh-grade students. We want to know how well...
The data from data421.dat contains information on 78 seventh-grade students. We want to know how well each of IQ score and self-concept score predicts GPA using least-squares regression. We also want to know which of these explanatory variables predicts GPA better. Give numerical measures that answer these questions. (Round your answers to three decimal places.) find:(Regressor: IQ) R 2 find: (Regressor: Self-Concept) R 2 obs gpa iq gender concept 1 7.94 103 2 54 2 8.292 111 2 73 3...
The data from data95.dat contains information on 78 seventh-grade students. We want to know how well each of IQ score and self-concept score predicts GPA using least-squares regression. We also want t...
The data from data95.dat contains information on 78 seventh-grade students. We want to know how well each of IQ score and self-concept score predicts GPA using least-squares regression. We also want to know which of these explanatory variables predicts GPA better. Give numerical measures that answer these questions. (Round your answers to three decimal places.) (Regressor: IQ) R 2 : (Regressor: Self-Concept) R 2 : Which variable is the better predictor? IQSelf Concept obs gpa iq gender concept 1 7.94...
Hello, I need question 1 sections a,b,and c. Please make around a page long. CHAPTER 4...
 Hello, I need question 1 sections a,b,and c. Please make around
a page long.
CHAPTER 4 Techniques for Understanding Consumer Demand and Behavior 109 t effect. ed that managers be familiar with both approaches because each provides useful ues need to realize that marketing analysis builkds on the fundamental eco- of demand and elasticity. Marketers take these basie economie n Table 3.7 in goies and develop analyses of brand differentiation, market segmentation, and dct pricing, While some of the formal...
Hello, I need question 1 sections a,b,and c. Please make around
a page long.
CHAPTER 4 Techniques for Understanding Consumer Demand and Behavior 109 t effect. ed that managers be familiar with both approaches because each provides useful ues need to realize that marketing analysis builkds on the fundamental eco- of demand and elasticity. Marketers take these basie economie n Table 3.7 in goies and develop analyses of brand differentiation, market segmentation, and dct pricing, While some of the formal...
What kind of instruments were used in the study? Did it clearly link to the research...
 What kind of instruments were used in the study? Did it
clearly link to the research question? (One paragraph
minimum)
Page Organlzation of Hospital Nursing and 30-day Readmissions In Medicare Patlents Undergoing Surgery Chenjuan Ma, PhD National Database of Nursing Quality Indicators, University of Kansas School of Nursing 3901 Rainbow Bvd, M/S 3060 Kansas City, KS 66160, USA Matthew D McHugh, PhD, and Center for Heath Outcomes and Palcy Research University of Pennsyivania School of Nursing 418 Cune Bivd., Fagin...
What kind of instruments were used in the study? Did it
clearly link to the research question? (One paragraph
minimum)
Page Organlzation of Hospital Nursing and 30-day Readmissions In Medicare Patlents Undergoing Surgery Chenjuan Ma, PhD National Database of Nursing Quality Indicators, University of Kansas School of Nursing 3901 Rainbow Bvd, M/S 3060 Kansas City, KS 66160, USA Matthew D McHugh, PhD, and Center for Heath Outcomes and Palcy Research University of Pennsyivania School of Nursing 418 Cune Bivd., Fagin...
STAT 200 Week 2 Homework Problems 2.2.2 The median incomes of females in each state of...
 STAT 200 Week 2 Homework Problems 2.2.2 The median incomes of females in each state of the United States, including the District of Columbia and Puerto Rico, are given in table #2.2.10 ("Median income of," 2013). Create a frequency distribution, relative frequency distribution, and cumulative frequency distribution using 7 classes Table 82.2.10: Data of Median Income for Females $31 862 $40 550 $36.048 $30 752 $41817 $40,236 $47 476 $40 500 S60 | S35438 37.242 | S31,238-39.150 34,023 | S33.745...
(Just need help with part F) File_size_(MB) Time_(sec) 77 31.1 93 35.1 85 35.3 94 35.7...
 (Just need help with part F)
File_size_(MB) Time_(sec)
77 31.1
93 35.1
85 35.3
94 35.7
20 14.4
74 28.9
68 29.6
88 33.5
42 21.7
20 15.3
72 28.4
24 11.5
95 35.7
59 25.6
93 36.6
71 29.1
87 34.3
92 37.2
90 35.6
67 26.8
87 32.6
83 31.2
80 34.1
57 22.8
52 25.4
76 28.9
96 38.7
70 31.8
59 24.2
57 28.1
Before taking the plunge into videoconferencing, a company ran tests of its...
(Just need help with part F)
File_size_(MB) Time_(sec)
77 31.1
93 35.1
85 35.3
94 35.7
20 14.4
74 28.9
68 29.6
88 33.5
42 21.7
20 15.3
72 28.4
24 11.5
95 35.7
59 25.6
93 36.6
71 29.1
87 34.3
92 37.2
90 35.6
67 26.8
87 32.6
83 31.2
80 34.1
57 22.8
52 25.4
76 28.9
96 38.7
70 31.8
59 24.2
57 28.1
Before taking the plunge into videoconferencing, a company ran tests of its...
 WBWK7-Sects7.8and8.1-8.4: Problem 6 Prev Up Next 2 pts) Ten randomly selected people took an lQ test A, and next day they took a very similar IQ test B. Their scores are shown in the table below. Person 12 345 67 8 9 10 Test A 93 104 100 103 90 108 123 82 74 114 Test B 196 108 102 108 87 107 1228172 119 1. Consider (Test A - Test B). Use a 0.01 significance level to test the...
 The bullsh sentment of individual investors was 27.6% AAr Ja mal, measures were based on a poll conducted by the American Association of Individual Investors. Assume that each bulish sentiment measure was based on a sample of 240 investors a. Develop a 95% conf dence interval for the dmerence between the bullish sentinert measures for the rost recent two weeks (to 3 de deals) February 2009). The bullsh sentment was reported to be 48.7% one week earier and 39.7% one...
 Suppose IQ scores were obtained from randomly selected siblings. For 20 such pairs of people, the linear correlation coefficient is 0.916 and the equation of the regression line is ý = - 3.14 +1.02x, where x represents the IQ score of the younger child. Also, the 20 x values have a mean of 103.21 and the 20 y values have a mean of 102.1. What is the best predicted IQ of the older child, given that the younger child has...
 URGENT PLEASE HELP!
The director of a training program for a large insurance company
has the business objective of determining which training method is
best for training underwriters. The three methods to be evaluated
are classroom, online, and courseware app. The 30 trainees are
divided into three randomly assigned groups of 10. Before the start
of the training, each trainee is given a proficiency exam that
measures mathematics and computer skills. At the end of the
training, all students take...
URGENT PLEASE HELP!
The director of a training program for a large insurance company
has the business objective of determining which training method is
best for training underwriters. The three methods to be evaluated
are classroom, online, and courseware app. The 30 trainees are
divided into three randomly assigned groups of 10. Before the start
of the training, each trainee is given a proficiency exam that
measures mathematics and computer skills. At the end of the
training, all students take...
 Hello, I need question 1 sections a,b,and c. Please make around
a page long.
CHAPTER 4 Techniques for Understanding Consumer Demand and Behavior 109 t effect. ed that managers be familiar with both approaches because each provides useful ues need to realize that marketing analysis builkds on the fundamental eco- of demand and elasticity. Marketers take these basie economie n Table 3.7 in goies and develop analyses of brand differentiation, market segmentation, and dct pricing, While some of the formal...
Hello, I need question 1 sections a,b,and c. Please make around
a page long.
CHAPTER 4 Techniques for Understanding Consumer Demand and Behavior 109 t effect. ed that managers be familiar with both approaches because each provides useful ues need to realize that marketing analysis builkds on the fundamental eco- of demand and elasticity. Marketers take these basie economie n Table 3.7 in goies and develop analyses of brand differentiation, market segmentation, and dct pricing, While some of the formal...
 What kind of instruments were used in the study? Did it
clearly link to the research question? (One paragraph
minimum)
Page Organlzation of Hospital Nursing and 30-day Readmissions In Medicare Patlents Undergoing Surgery Chenjuan Ma, PhD National Database of Nursing Quality Indicators, University of Kansas School of Nursing 3901 Rainbow Bvd, M/S 3060 Kansas City, KS 66160, USA Matthew D McHugh, PhD, and Center for Heath Outcomes and Palcy Research University of Pennsyivania School of Nursing 418 Cune Bivd., Fagin...
What kind of instruments were used in the study? Did it
clearly link to the research question? (One paragraph
minimum)
Page Organlzation of Hospital Nursing and 30-day Readmissions In Medicare Patlents Undergoing Surgery Chenjuan Ma, PhD National Database of Nursing Quality Indicators, University of Kansas School of Nursing 3901 Rainbow Bvd, M/S 3060 Kansas City, KS 66160, USA Matthew D McHugh, PhD, and Center for Heath Outcomes and Palcy Research University of Pennsyivania School of Nursing 418 Cune Bivd., Fagin...
 STAT 200 Week 2 Homework Problems 2.2.2 The median incomes of females in each state of the United States, including the District of Columbia and Puerto Rico, are given in table #2.2.10 ("Median income of," 2013). Create a frequency distribution, relative frequency distribution, and cumulative frequency distribution using 7 classes Table 82.2.10: Data of Median Income for Females $31 862 $40 550 $36.048 $30 752 $41817 $40,236 $47 476 $40 500 S60 | S35438 37.242 | S31,238-39.150 34,023 | S33.745...
 (Just need help with part F)
File_size_(MB) Time_(sec)
77 31.1
93 35.1
85 35.3
94 35.7
20 14.4
74 28.9
68 29.6
88 33.5
42 21.7
20 15.3
72 28.4
24 11.5
95 35.7
59 25.6
93 36.6
71 29.1
87 34.3
92 37.2
90 35.6
67 26.8
87 32.6
83 31.2
80 34.1
57 22.8
52 25.4
76 28.9
96 38.7
70 31.8
59 24.2
57 28.1
Before taking the plunge into videoconferencing, a company ran tests of its...
(Just need help with part F)
File_size_(MB) Time_(sec)
77 31.1
93 35.1
85 35.3
94 35.7
20 14.4
74 28.9
68 29.6
88 33.5
42 21.7
20 15.3
72 28.4
24 11.5
95 35.7
59 25.6
93 36.6
71 29.1
87 34.3
92 37.2
90 35.6
67 26.8
87 32.6
83 31.2
80 34.1
57 22.8
52 25.4
76 28.9
96 38.7
70 31.8
59 24.2
57 28.1
Before taking the plunge into videoconferencing, a company ran tests of its...
Most questions answered within 3 hours.
-
The English mathematician John Kerrich tossed a coin
10,000 times and obtained 5067 heads.
a. calculate...
asked 1 minute from now -
A process has an input as the flow q gal/min, and an
output temperature T Fahrenheit. Initially,...
asked 4 minutes ago -
A sample of 30 patients in a doctor's office showed that they
had to wait an...
asked 11 minutes ago -
Please write 6 to 10 paragraphs on the risks associated with
digging an underground hole.
Write...
asked 16 minutes ago -
The function x = (7.9 m) cos[(4πrad/s)t + π/3 rad] gives the
simple harmonic motion of...
asked 17 minutes ago -
A sample of steam with a mass of 0.501 g at a temperature of 100
∘C...
asked 50 minutes ago -
I1(t) and I2(t) describe the intensity of two
light waves.
I1(t)= 10sin(30t+π/4)
I2(t)=
10sin(30.4t+π)
Assume that...
asked 45 minutes ago -
True or False: Spinal nerves emerging from the vertebral column
are ONLY motor OR sensory.
Select...
asked 32 minutes ago -
last question i found wrong so downvoted so dont copy
paste or dont try if you...
asked 28 minutes ago -
A block sits on the floor. (a) What is the magnitude of the
frictional force on...
asked 51 minutes ago -
Thanks so much for the help! Please show all work.
A uniform solid disk with radius...
asked 32 minutes ago -
Please use Logicly!
Create a 4 bit sequential counter that is capable of counting up
or...
asked 40 minutes ago