
Homework Answers
The given data is as follows:
| Catalyst A | Catalyst B |
| 4.4 | 3.4 |
| 4.9 | 6.4 |
| 4.1 | 3.7 |
| 3.6 | 3.5 |
| 4.3 | 6.3 |
| 4.4 | 1.1 |
| 3.4 | 5 |
| 4.6 | 3.8 |
| 2.6 | 5.9 |
| 2.9 | 2.6 |
| 3.9 | 2.9 |
| 3.1 | 5.8 |
| 2.6 | 3.1 |
| 5.2 | 6.7 |
| 6.7 | 4.3 |
| 2.6 | 5.5 |
| 4.8 | 2.5 |
| 5.7 | 1.6 |
| 3.8 | 5.2 |
| 4.7 | 3.8 |
| 4.1 | |
| 4 | |
| 4.5 | |
| 4.5 |
Ans (a):
Histogram:
For Catalyst A:
Make the frequency distribution of the above data as:
| Catalyst A | frequency |
| 2.25-2.75 | 3 |
| 2.75-3.25 | 2 |
| 3.25-3.75 | 2 |
| 3.75-4.25 | 5 |
| 4.25-4.75 | 7 |
| 4.75-5.25 | 3 |
| 5.25-5.75 | 1 |
| 5.75-6.25 | 0 |
| 6.25-6.75 | 1 |
Then follow the given steps:
- In your spreadsheet, select the data to use for your histogram graph.
- Click Insert > Insert Column Chart, and then pick the clustered column graph.
- Click the graph and then click the icons next to the chart to add finishing touches.
Then the histogram:

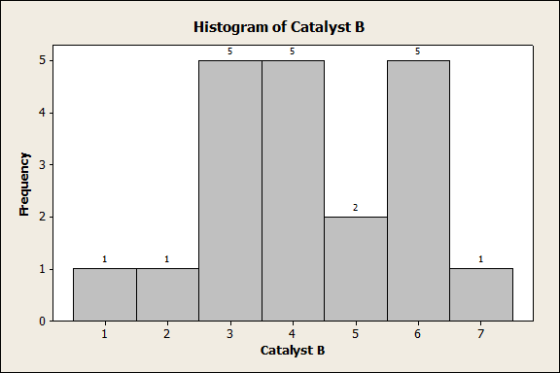
For Catalyst B:
Make the frequency distribution of the above data as:
| Catalyst B | Frequency |
| 0.5-1.5 | 1 |
| 1.5-2.5 | 1 |
| 2.5-3.5 | 5 |
| 3.5-4.5 | 5 |
| 4.5-5.5 | 2 |
| 5.5-6.5 | 5 |
| 6.5-7.5 | 1 |
Then follow the given steps:
- In your spreadsheet, select the data to use for your histogram graph.
- Click Insert > Insert Column Chart, and then pick the clustered column graph.
- Click the graph and then click the icons next to the chart to add finishing touches.
Then the histogram:
Ans (b):
Boxplots:

Ans (c):
Box plot is another way to describe a distribution of data. The vertical line within the box represents the median. The box plot is can be used to identify outliers. They can also be used to determine the skewness of a distribution. If the median is located lower side of the box, the distribution is right skewed, and if median is located on the upper side of the box, then the distribution is left skewed. If the median is located in the middle of the box, then the distribution is symmetrical.
Here for catalyst A, median = 4.2 which located at upper side. So, distribution for catalyst A is left skewed. And for catalyst B, median = 3.8 which located at lower side of the box. So, distribution for catalyst B is right skewed.
Catalyst A has an outlier (6.7).
There is much variation in the yields for catalyst B than the yields for catalyst A.
Add Answer to:
2. (20 pts) A certain reaction was run several times using each of two catalysts, A...
Parametirc test or not: Test statistic: p-value: decision: Is There A Difference Between the Means?
Parametirc test or not:Test statistic:p-value:decision:Is There A Difference Between the Means?6.7 6.2 3.1 310.3 10 5 5.56.9 5.5 3.3 3.110.5 6.3 4.3 5.44.5 4.6 1.8 25.6 5.6 2 2.65.9 6.1 2.1 2.58 11.7 4 4.68 7.4 3.3 3.15.8 5.2 3.1 2.96 7.3 3.0 3.28.7 5.3 2.7 36 5.5 2.1 2.27.2 6.3 3.5 3.25.9 4.6 2.9 3.46 7.4 3 3.37.2 7.8 3.7 3.48.6 9.4 5.1 5.77.2 8.1 2.8 3.15.8 5.4 2.2 1.83.3 4 1.7 1.86.8 5.1 2 1.83.7 3.5 2.2 2.112...
Using the data file provided with both variables, x and y, answer the following questions using...
Using the data file provided with both variables, x and y, answer the following questions using Excel*: 1.Create a scatterplot with the data. Comment on direction, form, strength, outliers and/or other significant findings. 2.Use the linear model to fit a line to the data and determine the equation ỹ = b0 + b1x and Interpret b0and b1. 3.Calculate the coefficient of correlation. Discuss the strength of correlation between the explanatory and response variables. 4.Predict the value for ỹ when you...
A local bank wants to study waiting times of customers. A subgroup of four customers is selected,...
 A local bank wants to study waiting times of customers. A subgroup of four customers is selected, and the time is measured from the point each customer enters the line to when he or she reaches the teller window. The results are shown in the data table. (a) Construct control charts for the range and the mean. (b) Is the process in control? EB Click the icon to view the data. Click the icon to view a table of control...
The data on the below shows the number of hours a particular drug is in the...
The data on the below shows the number of hours a particular drug is in the system of 200 females. Develop a histogram of this data according to the following intervals: Follow the directions. Test the hypothesis that these data are distributed exponentially. Determine the test statistic. Round to two decimal places. (sort the data first) [0, 3) [3, 6) [6, 9) [9, 12) [12, 18) [18, 24) [24, infinity) 34.7 11.8 10 7.8 2.8 20 9.8 20.4 1.2 7.2...
Saved 2023 A sample of 100 bank customer waiting times are given in the following table:...
 Saved 2023 A sample of 100 bank customer waiting times are given in the following table: Waiting Times (in Minutes) for the Bank Custoner Waiting Tine Case 4.5 9.7 11.8 10.4 4.2 7.e 5.5 8.7 8.8 5.1 5.4 4.5 6.2 3.9 8.7 7.6 4.7 4.0 4.0 10.1 .3 2.8 5.4 6.5 9.7 5.2 7.0 5.8 4.5 8.2 1.9 5.2 4.1 7.9 5.3 8.8 6.2 4.1 4.1 4.5 10.4 .2 7.0 6.8 5.5 8.3 11.3 5.9 8.8 2.8 6.7 5.5 5.e...
• 1. What are the quarterly growth rates (Percentage Change From Preceding Period in Real Gross...
 • 1. What are the quarterly growth rates (Percentage Change From Preceding Period in Real Gross Domestic Product) for the U.S. economy for the last six quarters? Report those numbers in your submission 2. What is the average of those 6 quarters? . 3. Is the average of those growth rates above or below the long-run U.S. annual growth rate of 3.5 percent? Bureau of Economke Analysis Table 1.1.1. Percent Change From Preceding Period in Real Gross Domestic Product Percent...
An object of weight 1 N is falling vertically. The time vs. speed data can be...
An object of weight 1 N is falling vertically. The time vs. speed data can be found here. In this case the effect of air-drag cannot be neglected. Use your critical thinking to estimate the air-drag coefficient . Make sure you include the units in your answer. 0 0 0.1 0.9992 0.2 1.993 0.3 2.978 0.4 3.948 0.5 4.898 0.6 5.826 0.7 6.728 0.8 7.599 0.9 8.438 1 9.242 1.1 10.01 1.2 10.74 1.3 11.43 1.4 12.09 1.5 12.7 1.6 ...
In a digital communication system, probability density function of the two level signal received in the...
 In a digital communication system, probability density function
of the two level signal received in the receiver is:
PR(v) =
PS(v)*PN(v) =
[0.4δ(v+1) + 0.6δ(v-4)]*η(v). And ,
η(v) is the noise that added to the message sign as the
additive Gaussian noise with a value of zero and an effective value
of 3.
(* symbol means convolution process, in the solution of this
problem you can use the below Q function table.) ,
η(v) =
A) Plot the probability density...
In a digital communication system, probability density function
of the two level signal received in the receiver is:
PR(v) =
PS(v)*PN(v) =
[0.4δ(v+1) + 0.6δ(v-4)]*η(v). And ,
η(v) is the noise that added to the message sign as the
additive Gaussian noise with a value of zero and an effective value
of 3.
(* symbol means convolution process, in the solution of this
problem you can use the below Q function table.) ,
η(v) =
A) Plot the probability density...
Use the following tide table to answer the questions in the Assessing Your Learning section of...
 Use the following tide table to answer the questions in the
Assessing Your Learning section of this lab. This tide table shows
the predicted ocean heights for Santa Cruz/Monterey Bay, California
during December 2011.
1. A visit to Santa Cruz/Monterey Bay, California is planned
during the week of December 4-10 to view the tide pools. To observe
intertidal animals during the daytime at the lowest possible tide,
the best time to visit the beach is on _________________ at
_________________. (4...
Use the following tide table to answer the questions in the
Assessing Your Learning section of this lab. This tide table shows
the predicted ocean heights for Santa Cruz/Monterey Bay, California
during December 2011.
1. A visit to Santa Cruz/Monterey Bay, California is planned
during the week of December 4-10 to view the tide pools. To observe
intertidal animals during the daytime at the lowest possible tide,
the best time to visit the beach is on _________________ at
_________________. (4...
CASE 1-5 Financial Statement Ratio Computation Refer to Campbell Soup Company's financial Campbell Soup statements in...
 CASE 1-5 Financial Statement Ratio Computation Refer to Campbell Soup Company's financial Campbell Soup statements in Appendix A. Required: Compute the following ratios for Year 11. Liquidity ratios: Asset utilization ratios:* a. Current ratio n. Cash turnover b. Acid-test ratio 0. Accounts receivable turnover c. Days to sell inventory p. Inventory turnover d. Collection period 4. Working capital turnover Capital structure and solvency ratios: 1. Fixed assets turnover e. Total debt to total equity s. Total assets turnover f. Long-term...
 A local bank wants to study waiting times of customers. A subgroup of four customers is selected, and the time is measured from the point each customer enters the line to when he or she reaches the teller window. The results are shown in the data table. (a) Construct control charts for the range and the mean. (b) Is the process in control? EB Click the icon to view the data. Click the icon to view a table of control...
 Saved 2023 A sample of 100 bank customer waiting times are given in the following table: Waiting Times (in Minutes) for the Bank Custoner Waiting Tine Case 4.5 9.7 11.8 10.4 4.2 7.e 5.5 8.7 8.8 5.1 5.4 4.5 6.2 3.9 8.7 7.6 4.7 4.0 4.0 10.1 .3 2.8 5.4 6.5 9.7 5.2 7.0 5.8 4.5 8.2 1.9 5.2 4.1 7.9 5.3 8.8 6.2 4.1 4.1 4.5 10.4 .2 7.0 6.8 5.5 8.3 11.3 5.9 8.8 2.8 6.7 5.5 5.e...
 • 1. What are the quarterly growth rates (Percentage Change From Preceding Period in Real Gross Domestic Product) for the U.S. economy for the last six quarters? Report those numbers in your submission 2. What is the average of those 6 quarters? . 3. Is the average of those growth rates above or below the long-run U.S. annual growth rate of 3.5 percent? Bureau of Economke Analysis Table 1.1.1. Percent Change From Preceding Period in Real Gross Domestic Product Percent...
 In a digital communication system, probability density function
of the two level signal received in the receiver is:
PR(v) =
PS(v)*PN(v) =
[0.4δ(v+1) + 0.6δ(v-4)]*η(v). And ,
η(v) is the noise that added to the message sign as the
additive Gaussian noise with a value of zero and an effective value
of 3.
(* symbol means convolution process, in the solution of this
problem you can use the below Q function table.) ,
η(v) =
A) Plot the probability density...
In a digital communication system, probability density function
of the two level signal received in the receiver is:
PR(v) =
PS(v)*PN(v) =
[0.4δ(v+1) + 0.6δ(v-4)]*η(v). And ,
η(v) is the noise that added to the message sign as the
additive Gaussian noise with a value of zero and an effective value
of 3.
(* symbol means convolution process, in the solution of this
problem you can use the below Q function table.) ,
η(v) =
A) Plot the probability density...
 Use the following tide table to answer the questions in the
Assessing Your Learning section of this lab. This tide table shows
the predicted ocean heights for Santa Cruz/Monterey Bay, California
during December 2011.
1. A visit to Santa Cruz/Monterey Bay, California is planned
during the week of December 4-10 to view the tide pools. To observe
intertidal animals during the daytime at the lowest possible tide,
the best time to visit the beach is on _________________ at
_________________. (4...
Use the following tide table to answer the questions in the
Assessing Your Learning section of this lab. This tide table shows
the predicted ocean heights for Santa Cruz/Monterey Bay, California
during December 2011.
1. A visit to Santa Cruz/Monterey Bay, California is planned
during the week of December 4-10 to view the tide pools. To observe
intertidal animals during the daytime at the lowest possible tide,
the best time to visit the beach is on _________________ at
_________________. (4...
 CASE 1-5 Financial Statement Ratio Computation Refer to Campbell Soup Company's financial Campbell Soup statements in Appendix A. Required: Compute the following ratios for Year 11. Liquidity ratios: Asset utilization ratios:* a. Current ratio n. Cash turnover b. Acid-test ratio 0. Accounts receivable turnover c. Days to sell inventory p. Inventory turnover d. Collection period 4. Working capital turnover Capital structure and solvency ratios: 1. Fixed assets turnover e. Total debt to total equity s. Total assets turnover f. Long-term...
Most questions answered within 3 hours.
-
Describe two obstacles that makes fixing atmospheric nitrogen
difficult.
asked 2 minutes ago -
T
F 53) Most differences
between human groups are the result of biology rather than
culture....
asked 6 minutes ago -
A 5.20 mW helium neon laser emits a visible laser beam with a
wavelength of 633...
asked 9 minutes ago -
Assignment:
Your
organization has made a strategic decision
to
outsourcework
currently performed in house. You have...
asked 8 minutes ago -
A hospital performs 100 surgeries per week. The probability that
complications after surgery occur is 10%....
asked 9 minutes ago -
In preparing its cash flow statement for the year ended December
31, 2018, Green Co. gathered...
asked 10 minutes ago -
Donna is 18 years old and full time accounting student.She is
saving for an overseas holiday...
asked 11 minutes ago -
Service-oriented architectures (SOA) provide
object-oriented architectures for web platforms that represent a
collection of services. SOA...
asked 11 minutes ago -
Le Terroir Winery is considering an expansion project to produce
fine wines. The trial expansion will...
asked 20 minutes ago -
The Bahraini public budget experiences deficit in the last
seven years, what are procedures are taken...
asked 27 minutes ago -
You invested $30,000 in a mutual fund at the beginning of the
year when the NAV...
asked 31 minutes ago -
Would you expect the price elasticity of supply for guitars to
be more inelastic in the...
asked 33 minutes ago