7.5 5.6 5.5 3.5 9.8 8.8 5.6 8.8 5.8 3.9 2.8 4.1 8.6 7.1 Time in minutes 9.7 8.6 8.9 8.2 4.6 9.2 5.9 5.5 4.8 7.8 3.3 3.5 5.5 4.7 9.8 5.6 8.4 4.9 6.1 5.8 7.5 5.5 8 4.8 4.8 4.5 1.3 9.7 5.4 7.2 9.5 4.9 8.4 6.4 6.1 10 3.3 3.8 12 13 14 15 16 17 18 19 20 6.6 5.3 4.9 7.2 6.1 6.5 6.4 5.7 6.9 6.4 5.2 8.1 6.6 9.5 8.4 6.7 6.8 3.1 2.7 3.9
Number of Observations in Sample/Subgroup (n) 0.853 0.888 0.880 0.864 0.848 0.833 0.820 0.808 3.267 2.575 1.128 1.880 1.023 2.059 2.326 2.534 2.704 2.847 2.970 3.078 3.173 3.258 3.336 3.407 0 0 0 0.076 0.136 0.184 0.223 0.256 0.283 0.307 0.328 0.347 0.363 0.378 0.391 0.404 0.415 0.577 0.483 0.419 0.373 0.337 0.308 0.285 0.266 0.249 0.235 0.223 0.212 0.203 0.194 0.187 0.180 2.114 2.004 1.924 1.864 0.787 1.744 12 0.770 0.763 0.756 0.750 0.744 0.739 0.733 0.729 0.724 1.672 15 3.532 3.588 3.640 3.689 3.735 3.778 3.819 3.858 3.895 3.931 1.637 1.622 1.609 1.596 1.585 1.575 1.565 1.557 1.548 1.541 17 20 0.435 0.443 0.452 0.459 0.167 0.162 0.157 0.153 0.712 0.708 25 Number of Observations in Sample/Subgroup (n)
Homework Answers
We will use MINITAB software to answer this question.
a)
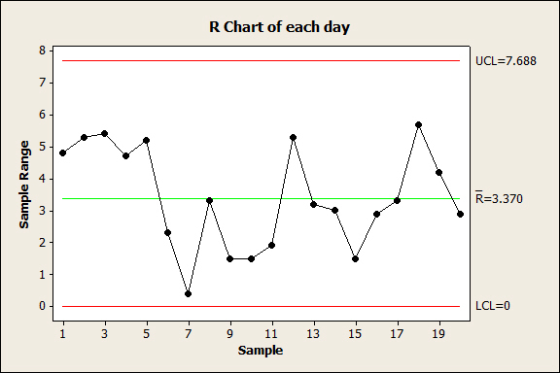
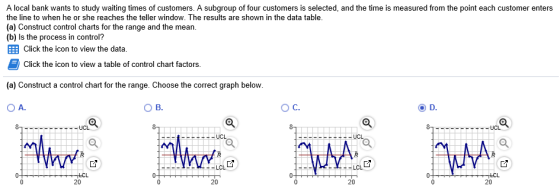
So the correct option is D
b) the range is in control as per the chart ( all points are withing the control limits)
please up-vote the solution
Add Answer to:
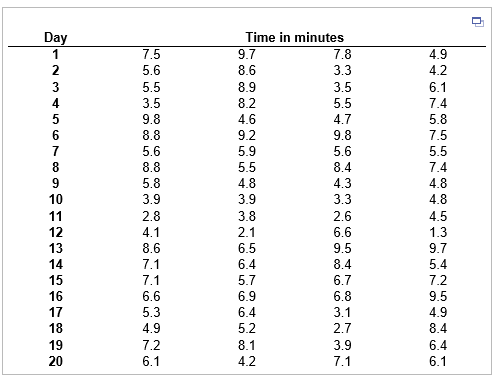
A local bank wants to study waiting times of customers. A subgroup of four customers is selected,...
Saved 2023 A sample of 100 bank customer waiting times are given in the following table:...
 Saved 2023 A sample of 100 bank customer waiting times are given in the following table: Waiting Times (in Minutes) for the Bank Custoner Waiting Tine Case 4.5 9.7 11.8 10.4 4.2 7.e 5.5 8.7 8.8 5.1 5.4 4.5 6.2 3.9 8.7 7.6 4.7 4.0 4.0 10.1 .3 2.8 5.4 6.5 9.7 5.2 7.0 5.8 4.5 8.2 1.9 5.2 4.1 7.9 5.3 8.8 6.2 4.1 4.1 4.5 10.4 .2 7.0 6.8 5.5 8.3 11.3 5.9 8.8 2.8 6.7 5.5 5.e...
Parametirc test or not: Test statistic: p-value: decision: Is There A Difference Between the Means?
Parametirc test or not:Test statistic:p-value:decision:Is There A Difference Between the Means?6.7 6.2 3.1 310.3 10 5 5.56.9 5.5 3.3 3.110.5 6.3 4.3 5.44.5 4.6 1.8 25.6 5.6 2 2.65.9 6.1 2.1 2.58 11.7 4 4.68 7.4 3.3 3.15.8 5.2 3.1 2.96 7.3 3.0 3.28.7 5.3 2.7 36 5.5 2.1 2.27.2 6.3 3.5 3.25.9 4.6 2.9 3.46 7.4 3 3.37.2 7.8 3.7 3.48.6 9.4 5.1 5.77.2 8.1 2.8 3.15.8 5.4 2.2 1.83.3 4 1.7 1.86.8 5.1 2 1.83.7 3.5 2.2 2.112...
An object of weight 1 N is falling vertically. The time vs. speed data can be...
An object of weight 1 N is falling vertically. The time vs. speed data can be found here. In this case the effect of air-drag cannot be neglected. Use your critical thinking to estimate the air-drag coefficient . Make sure you include the units in your answer. 0 0 0.1 0.9992 0.2 1.993 0.3 2.978 0.4 3.948 0.5 4.898 0.6 5.826 0.7 6.728 0.8 7.599 0.9 8.438 1 9.242 1.1 10.01 1.2 10.74 1.3 11.43 1.4 12.09 1.5 12.7 1.6 ...
The data on the below shows the number of hours a particular drug is in the...
The data on the below shows the number of hours a particular drug is in the system of 200 females. Develop a histogram of this data according to the following intervals: Follow the directions. Test the hypothesis that these data are distributed exponentially. Determine the test statistic. Round to two decimal places. (sort the data first) [0, 3) [3, 6) [6, 9) [9, 12) [12, 18) [18, 24) [24, infinity) 34.7 11.8 10 7.8 2.8 20 9.8 20.4 1.2 7.2...
Cyclic Consumer Industrial Full data set 3.7 12.6 48.7 5.4 14.9 - 23.4 23.5 13.2 -4.5...
 Cyclic Consumer Industrial Full data set 3.7 12.6 48.7 5.4 14.9 - 23.4 23.5 13.2 -4.5 0.2 -7.7 5.9 36.1 45.4 -3.6 1.2 -1.1 2.3 24.4 5.8 42.4 -8.6 14.1 4.5 -17,6 -7.6 45.8 -5.2 3.2 22.6 10.8 -3.7 6.4 - 26.8 38.1 8.4 29.6 36.9 1.1 8,5 18.6 1.5 -17.1 21.5 30.3 20.8 2.7 6.5 17.6 29.5 18.8 13.1 16.7 12.9 -8.8 5.2 - 9.5 1.7 34.6 -4.7 12.7 26.4 -9.2 32.9 36.5 -8.4 -27.8 9.2 33.8 23.1 1.1...
The data contained in the file named StateUnemp show the unemployment rate in March 2011 and...
The data contained in the file named StateUnemp show the unemployment rate in March 2011 and the unemployment rate in March 2012 for every state.† State Unemploy- ment Rate March 2011 Unemploy- ment Rate March 2012 Alabama 9.3 7.3 Alaska 7.6 7.0 Arizona 9.6 8.6 Arkansas 8.0 7.4 California 11.9 11.0 Colorado 8.5 7.8 Connecticut 9.1 7.7 Delaware 7.3 6.9 Florida 10.7 ...
5.6 Year 1981 1982 1983 1984 1985 1986 1987 1988 1989 1990 1991 1992 1993 1994...
 5.6 Year 1981 1982 1983 1984 1985 1986 1987 1988 1989 1990 1991 1992 1993 1994 1995 1996 1997 1998 1999 2000 2001 2002 2003 2004 2005 2006 2007 2008 x (L1) y (L2) Inflation Unemployment 8.9 7.6 3.8 9.7 3.8 9.6 3.9 7.5 3.8 7.2 1.1 7 4.4 6.2 4.4 5.5 4.6 5.3 6.1 3.1 6.8 2.9 7.5 2.7 6.9 2.7 6.1 2.5 5.6 3.3 5.4 1.7 4.9 1.6 4.5 2.7 4.2 4 1.6 4.7 2.4 5.8 1.9 6...
The following table shows the inflation rate and unemployment rate, both in percent, for the years...
 The following table shows the inflation rate and unemployment rate, both in percent, for the years 1981-2008. We will investigate some methods for predicting unemployment. 4.4 X (L1) y (L2) Year Inflation Unemployment 1981 8.9 7.6 1982 3.8 9.7 1983 3.8 9.6 1984 3.9 7.5 1985 3.8 7.2 1986 1.1 7 1987 6.2 1988 4.4 5.5 1989 4.6 5.3 1990 6.1 5.6 1991 3.1 6.8 1992 2.9 7.5 1993 2.7 6.9 1994 2.7 6.1 1995 2.5 5.6 1996 5.4 1997...
(a) A recent study of home technologies reported (as per the following table) the number of...
(a) A recent study of home technologies reported (as per the following table) the number of hours of personal computer usage per week for a sample of 60 persons. 9.3 5.3 6.3 8.8 6.5 0.6 5.2 6.6 9.3 4.3 6.3 2.1 2.7 0.4 3.7 3.3 1.1 2.7 6.7 6.5 4.3 9.7 7.7 5.2 1.7 8.5 4.2 5.5 5.1 5.6 5.4 4.8 2.1 10.1 1.3 5.6 2.4 2.4 4.7 1.7 2.0 6.7 1.1 6.7 2.2 2.6 9.8 6.4 4.9 5.2 4.5...
An aldol condensation reaction was performed where benzaldehyde and cyclopentanone were used. The product is 2,5...
 An aldol condensation reaction was performed where benzaldehyde
and cyclopentanone were used. The product is 2,5
dibenzylidenecyclopentanone or just 2-benzylidenecyclopentanone.
The spectra correspond with the aldehyde being benzaldehyde but the
ketone used could either be acetone, cyclopentanone or cyclohexane.
I need to find the NMR spectra that correspond to cyclopentanone
being the ketone in the aldol condensation. Which NMR spectra
correspond to the correct product?
I think the second set is with cyclohexanone and not
cyclopentanone but I could be...
An aldol condensation reaction was performed where benzaldehyde
and cyclopentanone were used. The product is 2,5
dibenzylidenecyclopentanone or just 2-benzylidenecyclopentanone.
The spectra correspond with the aldehyde being benzaldehyde but the
ketone used could either be acetone, cyclopentanone or cyclohexane.
I need to find the NMR spectra that correspond to cyclopentanone
being the ketone in the aldol condensation. Which NMR spectra
correspond to the correct product?
I think the second set is with cyclohexanone and not
cyclopentanone but I could be...
 Saved 2023 A sample of 100 bank customer waiting times are given in the following table: Waiting Times (in Minutes) for the Bank Custoner Waiting Tine Case 4.5 9.7 11.8 10.4 4.2 7.e 5.5 8.7 8.8 5.1 5.4 4.5 6.2 3.9 8.7 7.6 4.7 4.0 4.0 10.1 .3 2.8 5.4 6.5 9.7 5.2 7.0 5.8 4.5 8.2 1.9 5.2 4.1 7.9 5.3 8.8 6.2 4.1 4.1 4.5 10.4 .2 7.0 6.8 5.5 8.3 11.3 5.9 8.8 2.8 6.7 5.5 5.e...
 Cyclic Consumer Industrial Full data set 3.7 12.6 48.7 5.4 14.9 - 23.4 23.5 13.2 -4.5 0.2 -7.7 5.9 36.1 45.4 -3.6 1.2 -1.1 2.3 24.4 5.8 42.4 -8.6 14.1 4.5 -17,6 -7.6 45.8 -5.2 3.2 22.6 10.8 -3.7 6.4 - 26.8 38.1 8.4 29.6 36.9 1.1 8,5 18.6 1.5 -17.1 21.5 30.3 20.8 2.7 6.5 17.6 29.5 18.8 13.1 16.7 12.9 -8.8 5.2 - 9.5 1.7 34.6 -4.7 12.7 26.4 -9.2 32.9 36.5 -8.4 -27.8 9.2 33.8 23.1 1.1...
 5.6 Year 1981 1982 1983 1984 1985 1986 1987 1988 1989 1990 1991 1992 1993 1994 1995 1996 1997 1998 1999 2000 2001 2002 2003 2004 2005 2006 2007 2008 x (L1) y (L2) Inflation Unemployment 8.9 7.6 3.8 9.7 3.8 9.6 3.9 7.5 3.8 7.2 1.1 7 4.4 6.2 4.4 5.5 4.6 5.3 6.1 3.1 6.8 2.9 7.5 2.7 6.9 2.7 6.1 2.5 5.6 3.3 5.4 1.7 4.9 1.6 4.5 2.7 4.2 4 1.6 4.7 2.4 5.8 1.9 6...
 The following table shows the inflation rate and unemployment rate, both in percent, for the years 1981-2008. We will investigate some methods for predicting unemployment. 4.4 X (L1) y (L2) Year Inflation Unemployment 1981 8.9 7.6 1982 3.8 9.7 1983 3.8 9.6 1984 3.9 7.5 1985 3.8 7.2 1986 1.1 7 1987 6.2 1988 4.4 5.5 1989 4.6 5.3 1990 6.1 5.6 1991 3.1 6.8 1992 2.9 7.5 1993 2.7 6.9 1994 2.7 6.1 1995 2.5 5.6 1996 5.4 1997...
 An aldol condensation reaction was performed where benzaldehyde
and cyclopentanone were used. The product is 2,5
dibenzylidenecyclopentanone or just 2-benzylidenecyclopentanone.
The spectra correspond with the aldehyde being benzaldehyde but the
ketone used could either be acetone, cyclopentanone or cyclohexane.
I need to find the NMR spectra that correspond to cyclopentanone
being the ketone in the aldol condensation. Which NMR spectra
correspond to the correct product?
I think the second set is with cyclohexanone and not
cyclopentanone but I could be...
An aldol condensation reaction was performed where benzaldehyde
and cyclopentanone were used. The product is 2,5
dibenzylidenecyclopentanone or just 2-benzylidenecyclopentanone.
The spectra correspond with the aldehyde being benzaldehyde but the
ketone used could either be acetone, cyclopentanone or cyclohexane.
I need to find the NMR spectra that correspond to cyclopentanone
being the ketone in the aldol condensation. Which NMR spectra
correspond to the correct product?
I think the second set is with cyclohexanone and not
cyclopentanone but I could be...
Most questions answered within 3 hours.
-
A 5.20 mW helium neon laser emits a visible laser beam with a
wavelength of 633...
asked 1 minute from now -
In preparing its cash flow statement for the year ended December
31, 2018, Green Co. gathered...
asked 12 seconds from now -
Donna is 18 years old and full time accounting student.She is
saving for an overseas holiday...
asked 13 seconds ago -
Service-oriented architectures (SOA) provide
object-oriented architectures for web platforms that represent a
collection of services. SOA...
asked 45 seconds ago -
Le Terroir Winery is considering an expansion project to produce
fine wines. The trial expansion will...
asked 9 minutes ago -
The Bahraini public budget experiences deficit in the last
seven years, what are procedures are taken...
asked 16 minutes ago -
You invested $30,000 in a mutual fund at the beginning of the
year when the NAV...
asked 20 minutes ago -
Would you expect the price elasticity of supply for guitars to
be more inelastic in the...
asked 22 minutes ago -
A snowmobile is originally at the point with position vector
30.1 m at 95.0° counterclockwise from...
asked 22 minutes ago -
MAN3240 Organizational Behavior
In one to two paragraphs
6.) How can understanding emotions make me more...
asked 30 minutes ago -
Identify one individual who, in your opinion, is an excellent
leader. List the qualities that this...
asked 27 minutes ago -
For the data set shown below, complete parts (a) through (d)
below. x 3 4 5...
asked 33 minutes ago