![Question 2 [30pts]: By using a 3x1 subplot, plot x(t) signal in the first row. Take t between 0 s and 10 s with an increment](http://img.homeworklib.com/questions/68ef48e0-94df-11eb-a9e9-ef84e5c83f7f.png?x-oss-process=image/resize,w_560)
Homework Answers
Question (1)
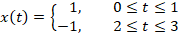
I think the signal given is
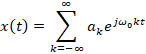
Exponential Fourier Series
Any continuous time periodic signal, with a fundamental period
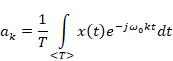
 can be represented as
where
For the signal x(t) the fundamental time period is given as
 .
.
The angular frequency of the signal will be

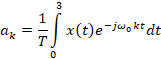
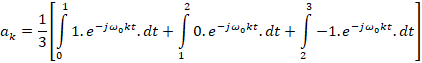
The signal is given as
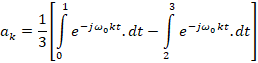
So
![ax = [-[e-juok – 1] + [e-jag k3 – e-jwgk2]]](http://img.homeworklib.com/questions/6f33d1c0-94df-11eb-b09b-b3d4616a5f80.png?x-oss-process=image/resize,w_560)
![[Proxer-8 + omxz_– 04_– 1] + =](http://img.homeworklib.com/questions/6f7e65e0-94df-11eb-9834-797a3d8a57e5.png?x-oss-process=image/resize,w_560)
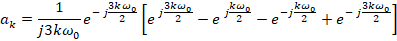

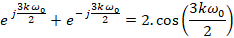
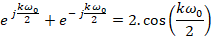
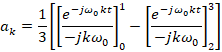
So
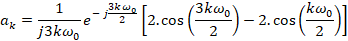
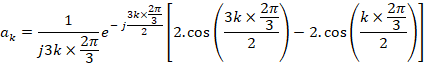
Substitute 
![ax = 7e- jkn [2.cos(tk) – 2.cos(k)]](http://img.homeworklib.com/questions/71de99e0-94df-11eb-ae96-4d6ecf2448b3.png?x-oss-process=image/resize,w_560)
![as a pieska (cos(uk) – cos (5x)]](http://img.homeworklib.com/questions/722c0a90-94df-11eb-ae19-d5a33c2ef430.png?x-oss-process=image/resize,w_560)
Using

We get
 **= 30](http://img.homeworklib.com/questions/72bdeae0-94df-11eb-af7d-834cce7be8b8.png?x-oss-process=image/resize,w_560)
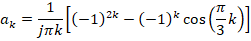
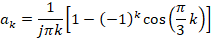
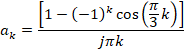
For k = 0, the above will be indeterminate. So we can find the value using L Hospitals rule
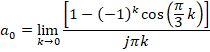
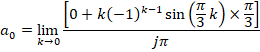

So the Fourier Coefficients are
![k=0 on = {{– (-1)+cos[:)] kto jik](http://img.homeworklib.com/questions/74d35170-94df-11eb-b159-4512e12a598b.png?x-oss-process=image/resize,w_560)
Question (2)
MATLAB Code
clc;
clear all;
close all;
T = 3;
t = 0:0.001:10;
t1 = [0:0.001:1];
t2 = [1.001:0.001:2];
t3 = [2.001:0.001:3-0.001];
x1 = ones(1,length(t1));
x2 = zeros(1,length(t2));
x3 = -1*ones(1,length(t3));
x_org = [x1, x2, x3, x1, x2, x3, x1, x2, x3, x1];
subplot(3,1,1);
plot(t, x_org, 'linewidth',2);
grid
xlabel('Time, t (s)');
ylabel('Amplitude ');
title('The original signal x(t)');
w0 = 2*pi/3;
a0 = 0;
x = a0;
for k = -10:10
if k ~= 0
ak = (1 - (-1)^k*cos(pi/3*k))/(j*pi*k);
x = x + ak*exp(j*k*w0*t);
end
end
subplot(3,1,2);
plot(t, x, 'linewidth',2);
grid
xlabel('Time, t (s)');
ylabel('Amplitude ');
title('The signal x(t) for N = 10');
a0 = 0;
x = a0;
for k = -100:100
if k ~= 0
ak = (1 - (-1)^k*cos(pi/3*k))/(j*pi*k);
x = x + ak*exp(j*k*w0*t);
end
end
subplot(3,1,3);
plot(t, x, 'linewidth',2);
grid
xlabel('Time, t (s)');
ylabel('Amplitude ');
title('The signal x(t) for N = 100');
The plots
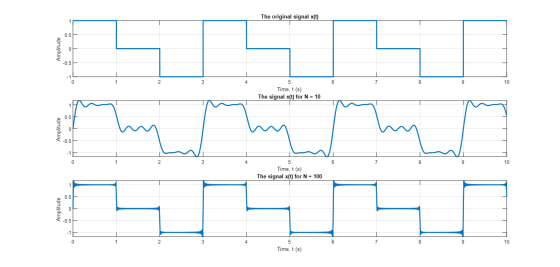
As N increases, the signal becomes more accurate to the original signal
Add Answer to:
Question 2 [30pts]: By using a 3x1 subplot, plot x(t) signal in the first row. Take...
A periodic signal, x(t) is shown below. A = 10, T-4 sec. -T Write a MATLAB script to plot the sig...
 A periodic signal, x(t) is shown below. A = 10, T-4 sec. -T Write a MATLAB script to plot the signal, using enough points to get a smooth curve. Compute the Fourier series coefficients for the signal (if you can find them in the text, that is ok). Plot the single-sided or double-sided spectra for each signal. Include enough frequencies in the plots to adequately represent the frequency content of the signals. Plot partial sums of the Fourier series for...
1. We have a signal, x (t), with period of T - 2 second with the signal in one period given below: x(t)- ^x,(t+nT) wher...
 1. We have a signal, x (t), with period of T - 2 second with the signal in one period given below: x(t)- ^x,(t+nT) wherex,) 1-2 (t - ) Kt<1 n=-oo 0 1/2 (a) Find the Fourier series coefficients for this signal. That is, find the values of ak so that x (t) Hint: te-jwt teJwt dt (b) Write some MATLAB code which will plot the signal resulting from a truncated Fourier Series using the coefficients you calculated in part...
1. Suppose x(t) -3u(t+3) - u(t)+ 3H(t-3) - 5H(t-6) a. Sketch x(t). b. For the signal x(t) given, ...
 I need a Matlab code example plz
1. Suppose x(t) -3u(t+3) - u(t)+ 3H(t-3) - 5H(t-6) a. Sketch x(t). b. For the signal x(t) given, determine and sketch the following signals: ,g(t) x(t-6) g2(t) - x(3t-6) ii. s(t) x(3t-6) +2 c. Create a MATLAB script that uses a function to express x(t), and plots x(t) in the time interval- 5 < t < 8s, using a time increment of At= 0.01s. Next, use the function to graph each of the...
I need a Matlab code example plz
1. Suppose x(t) -3u(t+3) - u(t)+ 3H(t-3) - 5H(t-6) a. Sketch x(t). b. For the signal x(t) given, determine and sketch the following signals: ,g(t) x(t-6) g2(t) - x(3t-6) ii. s(t) x(3t-6) +2 c. Create a MATLAB script that uses a function to express x(t), and plots x(t) in the time interval- 5 < t < 8s, using a time increment of At= 0.01s. Next, use the function to graph each of the...
Problem 2 (Spectrum of a rectangular signal): In this problem, the amplitude spectrum of the signal 1 or Ot 2 ms x(t)- 0 otherwise is to be analysed (b) Numerical calculation of the spectrum: (i) Us...
 Problem 2 (Spectrum of a rectangular signal): In this problem, the amplitude spectrum of the signal 1 or Ot 2 ms x(t)- 0 otherwise is to be analysed (b) Numerical calculation of the spectrum: (i) Use Matlab to generate and plot a vector containing the sample values of the rectangular signal defined in (2) sampled at f 8kHz. Choose the number N of sample values so that it is a power of 2 and that the signal duration is at...
Given an energy signal x(t) = (t-5T)e-t-T) , where T-0.1 compute its energy spectrum density in...
 Given an energy signal x(t) = (t-5T)e-t-T) , where T-0.1 compute its energy spectrum density in Matlab 1. use two different methods to a. Get its spectrum using Fourier transformation, follovfed by the squaring its amplitude. Plot its Fourier transformation and its energy spectrum density. Get its autocorrelation function, followed by its Fourier transformation. Plot its autocorrelation function and its energy spectrum density. b. 2. In a multipath channel, the received signal y (t) x(t) 0.15x(t -6T) +0.09x(t 10.5T), plot...
can anyone solve this question for me please! -5 2. Express the signal x(t) as an...
 can anyone solve this question for me please!
-5 2. Express the signal x(t) as an exponential Fourier series. The time variable is in units of seconds. Use MATLAB to generate the signal x(t) as a partial sum of sinusoidal terms. Plot the resulting signal over a time interval that is at least three periods long. Generate a spectral plot showing separately magnitude as a function of k and phase as a function of k
can anyone solve this question for me please!
-5 2. Express the signal x(t) as an exponential Fourier series. The time variable is in units of seconds. Use MATLAB to generate the signal x(t) as a partial sum of sinusoidal terms. Plot the resulting signal over a time interval that is at least three periods long. Generate a spectral plot showing separately magnitude as a function of k and phase as a function of k
Consider the continuous time signal: 2. , π (sin (2t) (Sin (8t) A discrete time signal x[n] -xs(t) -x(nTs) is created by sampling x() with sampling interval, 2it 60 a) Plot the Fourier Transform of t...
 Consider the continuous time signal: 2. , π (sin (2t) (Sin (8t) A discrete time signal x[n] -xs(t) -x(nTs) is created by sampling x() with sampling interval, 2it 60 a) Plot the Fourier Transform of the sampled signal, i.e. Xs (jo). b) Plot the DTFT of the sampled signal, ie, X(eja) o) Repeat (a) with 7, 2π d) Repeat (b) with , 18
Consider the continuous time signal: 2. , π (sin (2t) (Sin (8t) A discrete time signal x[n]...
Consider the continuous time signal: 2. , π (sin (2t) (Sin (8t) A discrete time signal x[n] -xs(t) -x(nTs) is created by sampling x() with sampling interval, 2it 60 a) Plot the Fourier Transform of the sampled signal, i.e. Xs (jo). b) Plot the DTFT of the sampled signal, ie, X(eja) o) Repeat (a) with 7, 2π d) Repeat (b) with , 18
Consider the continuous time signal: 2. , π (sin (2t) (Sin (8t) A discrete time signal x[n]...
MATLAB Fourier transform. Suppose that a signal x(t) is sampled with sampling frequency fs =100Hz. The sequence x[n] obtained after the sampling is given below: Take the DFT of the sampled sequence a...
 MATLAB Fourier transform. Suppose that a signal x(t) is sampled
with sampling frequency fs =100Hz.
The sequence x[n] obtained after the sampling is given below:
Take the DFT of the sampled sequence and plot
its magnitude and phase.
What is the frequency resolution (Δf) of your plot?
N= 20, 100 Hz
N= 20, 100 Hz
MATLAB Fourier transform. Suppose that a signal x(t) is sampled
with sampling frequency fs =100Hz.
The sequence x[n] obtained after the sampling is given below:
Take the DFT of the sampled sequence and plot
its magnitude and phase.
What is the frequency resolution (Δf) of your plot?
N= 20, 100 Hz
N= 20, 100 Hz
Exercises: u used to the instructor b the end of next lab. 20 102 Plot the f(t)-sinc(20r) cos(300...
 Exercises: u used to the instructor b the end of next lab. 20 102 Plot the f(t)-sinc(20r) cos(300t)sinc (10t) cos(100t) Use the fast Fourier transform to find the magnitude and phase spectrum of the signal and plot over an appropriate range. Use appropriate values for the time interval and the sampling interval. Note that in Matlab sinc(x)-, so we need to divide the argument by n to make it match the given function. Le, sinc(20t/pi) Hint: Use the parameters from...
10. Find the Fourier transform of a continuous-time signal x(t) = 10e Su(t). Plot the magnitude...
 10. Find the Fourier transform of a continuous-time signal x(t) = 10e Su(t). Plot the magnitude spectrum and the phase spectrum. If the signal is going to be sampled, what should be the minimum sampling frequency so that the aliasing error is less than 0.1 % of the maximum original magnitude at half the sampling frequency. 11. A signal x(t) = 5cos(2nt + 1/6) is sampled at every 0.2 seconds. Find the sequence obtained over the interval 0 st 3...
 A periodic signal, x(t) is shown below. A = 10, T-4 sec. -T Write a MATLAB script to plot the signal, using enough points to get a smooth curve. Compute the Fourier series coefficients for the signal (if you can find them in the text, that is ok). Plot the single-sided or double-sided spectra for each signal. Include enough frequencies in the plots to adequately represent the frequency content of the signals. Plot partial sums of the Fourier series for...
 1. We have a signal, x (t), with period of T - 2 second with the signal in one period given below: x(t)- ^x,(t+nT) wherex,) 1-2 (t - ) Kt<1 n=-oo 0 1/2 (a) Find the Fourier series coefficients for this signal. That is, find the values of ak so that x (t) Hint: te-jwt teJwt dt (b) Write some MATLAB code which will plot the signal resulting from a truncated Fourier Series using the coefficients you calculated in part...
 I need a Matlab code example plz
1. Suppose x(t) -3u(t+3) - u(t)+ 3H(t-3) - 5H(t-6) a. Sketch x(t). b. For the signal x(t) given, determine and sketch the following signals: ,g(t) x(t-6) g2(t) - x(3t-6) ii. s(t) x(3t-6) +2 c. Create a MATLAB script that uses a function to express x(t), and plots x(t) in the time interval- 5 < t < 8s, using a time increment of At= 0.01s. Next, use the function to graph each of the...
I need a Matlab code example plz
1. Suppose x(t) -3u(t+3) - u(t)+ 3H(t-3) - 5H(t-6) a. Sketch x(t). b. For the signal x(t) given, determine and sketch the following signals: ,g(t) x(t-6) g2(t) - x(3t-6) ii. s(t) x(3t-6) +2 c. Create a MATLAB script that uses a function to express x(t), and plots x(t) in the time interval- 5 < t < 8s, using a time increment of At= 0.01s. Next, use the function to graph each of the...
 Problem 2 (Spectrum of a rectangular signal): In this problem, the amplitude spectrum of the signal 1 or Ot 2 ms x(t)- 0 otherwise is to be analysed (b) Numerical calculation of the spectrum: (i) Use Matlab to generate and plot a vector containing the sample values of the rectangular signal defined in (2) sampled at f 8kHz. Choose the number N of sample values so that it is a power of 2 and that the signal duration is at...
 Given an energy signal x(t) = (t-5T)e-t-T) , where T-0.1 compute its energy spectrum density in Matlab 1. use two different methods to a. Get its spectrum using Fourier transformation, follovfed by the squaring its amplitude. Plot its Fourier transformation and its energy spectrum density. Get its autocorrelation function, followed by its Fourier transformation. Plot its autocorrelation function and its energy spectrum density. b. 2. In a multipath channel, the received signal y (t) x(t) 0.15x(t -6T) +0.09x(t 10.5T), plot...
 can anyone solve this question for me please!
-5 2. Express the signal x(t) as an exponential Fourier series. The time variable is in units of seconds. Use MATLAB to generate the signal x(t) as a partial sum of sinusoidal terms. Plot the resulting signal over a time interval that is at least three periods long. Generate a spectral plot showing separately magnitude as a function of k and phase as a function of k
can anyone solve this question for me please!
-5 2. Express the signal x(t) as an exponential Fourier series. The time variable is in units of seconds. Use MATLAB to generate the signal x(t) as a partial sum of sinusoidal terms. Plot the resulting signal over a time interval that is at least three periods long. Generate a spectral plot showing separately magnitude as a function of k and phase as a function of k
 Consider the continuous time signal: 2. , π (sin (2t) (Sin (8t) A discrete time signal x[n] -xs(t) -x(nTs) is created by sampling x() with sampling interval, 2it 60 a) Plot the Fourier Transform of the sampled signal, i.e. Xs (jo). b) Plot the DTFT of the sampled signal, ie, X(eja) o) Repeat (a) with 7, 2π d) Repeat (b) with , 18
Consider the continuous time signal: 2. , π (sin (2t) (Sin (8t) A discrete time signal x[n]...
Consider the continuous time signal: 2. , π (sin (2t) (Sin (8t) A discrete time signal x[n] -xs(t) -x(nTs) is created by sampling x() with sampling interval, 2it 60 a) Plot the Fourier Transform of the sampled signal, i.e. Xs (jo). b) Plot the DTFT of the sampled signal, ie, X(eja) o) Repeat (a) with 7, 2π d) Repeat (b) with , 18
Consider the continuous time signal: 2. , π (sin (2t) (Sin (8t) A discrete time signal x[n]...
 MATLAB Fourier transform. Suppose that a signal x(t) is sampled
with sampling frequency fs =100Hz.
The sequence x[n] obtained after the sampling is given below:
Take the DFT of the sampled sequence and plot
its magnitude and phase.
What is the frequency resolution (Δf) of your plot?
N= 20, 100 Hz
N= 20, 100 Hz
MATLAB Fourier transform. Suppose that a signal x(t) is sampled
with sampling frequency fs =100Hz.
The sequence x[n] obtained after the sampling is given below:
Take the DFT of the sampled sequence and plot
its magnitude and phase.
What is the frequency resolution (Δf) of your plot?
N= 20, 100 Hz
N= 20, 100 Hz
 Exercises: u used to the instructor b the end of next lab. 20 102 Plot the f(t)-sinc(20r) cos(300t)sinc (10t) cos(100t) Use the fast Fourier transform to find the magnitude and phase spectrum of the signal and plot over an appropriate range. Use appropriate values for the time interval and the sampling interval. Note that in Matlab sinc(x)-, so we need to divide the argument by n to make it match the given function. Le, sinc(20t/pi) Hint: Use the parameters from...
 10. Find the Fourier transform of a continuous-time signal x(t) = 10e Su(t). Plot the magnitude spectrum and the phase spectrum. If the signal is going to be sampled, what should be the minimum sampling frequency so that the aliasing error is less than 0.1 % of the maximum original magnitude at half the sampling frequency. 11. A signal x(t) = 5cos(2nt + 1/6) is sampled at every 0.2 seconds. Find the sequence obtained over the interval 0 st 3...
Most questions answered within 3 hours.
-
Six years of quarterly data of a seasonally adjusted series are
used to estimate a linear...
asked 5 minutes ago -
Which of the following is not an ecological model used
to foster behavior change?
PRECEDE-PROCEED Model...
asked 8 minutes ago -
On the Apollo 14 mission to the moon, astronaut Alan Shepard hit
a golf ball with...
asked 4 minutes ago -
What are John’s potential claims if he is terminated
this week?
John is a 54-year-old man...
asked 18 minutes ago -
A (8.5) cm tall object is placed at a distance of (14.2) cm from
a convex...
asked 26 minutes ago -
(2) For the following questions, consider a data set that
exhibits a normal distribution. Report the...
asked 27 minutes ago -
What exactly is an information system? How does it work" What
are its people organization,
...
asked 29 minutes ago -
The Food Marketing Institute shows that 17% of households spend
more than $100 per week on...
asked 38 minutes ago -
Go to NCBI BLAST search web page
1st search: GEKDLRRAKDINQEVYNF
2nd search: PTSQRLQLLEPFDK
3rd search: GEKDLRRAKDINQEVYNF...
asked 42 minutes ago -
Explain how each of the following three conditions could be a
red flag for a register...
asked 47 minutes ago -
In a two-way factorial ANOVA, the final F-ratio for
factor AxB is determined by dividing _____...
asked 1 hour ago -
Show your solutions for answer.
4. An aqueous solution contains 9.21 g of
K4Fe(CN)6 in a...
asked 47 minutes ago