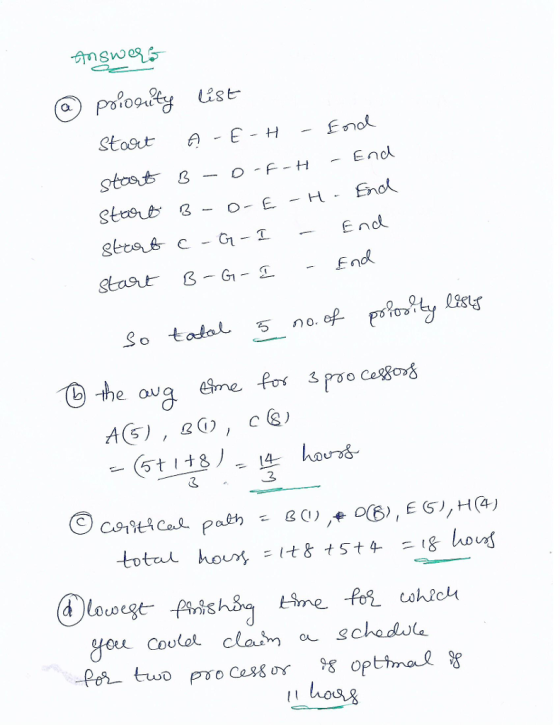
![Answer the following questions based on the PERT chart below with task times given in hours [All answer should be given as a single number only without units] A(5) E(5) Start B1) D(8) H(4) End C(6) G(3) 1(7) a. The number of priority lists that can be created for this project is b. The average time for 3 processors for this project is C. The critical time for this project is d. The lowest finishing time for which you could claim a schedule for two processors is optimal is e. The lowest finishing time for which you could claim a schedule for four processors is optimal is f. The earliest time that task E could be started by a processor in any schedule with any number of processors for this project would be start of the project. hours. hours. hours. hours hours after the](http://img.homeworklib.com/questions/08cd0d20-96ea-11eb-9f66-894cb36d9ea8.png?x-oss-process=image/resize,w_560) Answer the following questions
based on the PERT chart below with task times given in hours. [All
answer should be given as a single number only without units].
Answer the following questions
based on the PERT chart below with task times given in hours. [All
answer should be given as a single number only without units].
Homework Answers
Add Answer to:
Answer the following questions
based on the PERT chart below with task times given in hours....
Answer these questions for the following simple set of project tasks. Task times are shown in...
 Answer these questions for the following simple set of project tasks. Task times are shown in hours w a. What is the expected time that all five tasks will be completed? Expected time 20 hours b. What is the earliest start for task C? Earliest startſ 4th/nd hour c. What is the latest start for task A? Latest start 1 nd/st hour
HW12: Project Mgmt。 Saved Problem 15-4 Answer these questions for the following simple set of project tasks. Task times are shown in hours. Skipped eBook Print References a. What is the length of th...
 HW12: Project Mgmt。 Saved Problem 15-4 Answer these questions for the following simple set of project tasks. Task times are shown in hours. Skipped eBook Print References a. What is the length of the critical path? 1hou Length of thecriticalpath「 b. What are the earliest start and latest start for E? points Earliest start th/nd hour Latest stat thind hour Sklpped eBook Print References c. What is the latest start for B? test stat th/nd hour d. If all other...
5. For the following project digraph (processing times are in hours), please use the Backflow Process...
 5. For the following project digraph (processing times are in hours), please use the Backflow Process to find the critical time of each task, and list these in brackets. Then use the critical Path Algorithm (CPA) to find a work schedule for 3 processors, and state the Project Length and the Total Idle Time. (17 points) Project Digraph (10)[ ] 36(4)[]y, S col DAB ]0(1)(I HO ] 266] [volg? SEC)1-518)[] Z46)L]SENDLO) F (12) []J (10) [] MB][]> [0] CPA Work...
Given is a PERT project network diagram as shown below: Start End ctivity |StarA KEnd 15...
 Given is a PERT project network diagram as shown below: Start End ctivity |StarA KEnd 15 me 10 13 12 20 a) The Project Completion time = b) The Earliest Start time, ES, of Activity F- c) The Earliest Start time, ES, of Activity K = d) The Latest Start time, LS, of Activity. E = e) The non-critical activities are comma, no space) (ex. type in critical activities as ABCD, no
The table below shows the output from a system that uses PERT for project scheduling. The...
 The table below shows the output from a system that uses PERT for project scheduling. The project involves 12 interdependent activities and all times are reported in weeks. Based on the information provided, answer the following questions: IMMEDIATE EXPECTED ACTIVITY PREDECESSORS TIME EARLIEST EARLIEST LATEST LATEST START FINISH START FINISH 16 BNS lolos 12 4 31 28 43 32 10 6 38 D, J, K (a) What is the minimum expected time required to complete the project? (b) How is...
CHAPTER 13 / Developing and implementing Effective Accounting Information Systems 431 14 FIGURE 13-11 PERT network...
 CHAPTER 13 / Developing and implementing Effective Accounting Information Systems 431 14 FIGURE 13-11 PERT network diagram for a systems implementation project. 1 2 3 4 5 6 7 8 9 10 11 12 13 14 15 16 17 18 19 20 21 22 23 24 25 26 27 28 29 30 31 32 33 34 35 36 37 Activity Prepare the Physical site 3958 Determine functional changes Select and assign personnel Train personnel Acquire and install computer equipment Establish...
16) A partially solved PERT problem is detailed in the table below. Times are given in...
 16) A partially solved PERT problem is detailed in the table below. Times are given in weeks. Optimisti Activity Preceding Time Probable Pessimistie Expected Time Time Time Variance 10 8 19 20 - 니다 4-ww0 8 16 14 1 2.79 276 G + - 5 (a) Calculate the expected time and variance for each activity. Enter these values in the appropriate columns in the table above. (b) Which activities form the critical path? (c) What is the estimated time of...
Given the following information about a small project, Task Duration Immediate Estimates Predecessors A &n
Given the following information about a small project, Task Duration Immediate Estimates Predecessors A 2 days None B 5 days A C 4 days B D 9 days A E 4 days B & D F 12 days E & C Draw a network diagram. Identify the critical path, earliest start and finish and slack for each task. Using MS Excel, produce a Gantt chart for this project. What would happen if a new estimate for task D increases...
please answer from a until i with the solving steps CHAPTER 13 / Developing and implementing...
 please answer from a until i with the solving steps
CHAPTER 13 / Developing and implementing Effective Accounting Information Systems 431 14 FIGURE 13-11 PERT network diagram for a systems implementation project. 13-19. Do you understand PERT charts? Refer back to Figure 13-11 and answer the following questions: a. Which activity or activities must be completed before activity C can begin? b. Which activity or activities must be completed before activity G can begin? c. Which activity or activities must...
please answer from a until i with the solving steps
CHAPTER 13 / Developing and implementing Effective Accounting Information Systems 431 14 FIGURE 13-11 PERT network diagram for a systems implementation project. 13-19. Do you understand PERT charts? Refer back to Figure 13-11 and answer the following questions: a. Which activity or activities must be completed before activity C can begin? b. Which activity or activities must be completed before activity G can begin? c. Which activity or activities must...
Given all the information in the table, use PERT/CPM to help Mr. Hawthorne address to the...
 Given all the information in the table, use PERT/CPM to help Mr.
Hawthorne address to the following questions.
A. Create the network diagram representing the problem.
B. What is the total time expected to be required to complete
the project if no delays occur?
C. What are the earliest and latest start and finish times for
the individual activities required to meet the expected project
completion time provided in question B (show your method for
determining this)?
D. Which are...
Given all the information in the table, use PERT/CPM to help Mr.
Hawthorne address to the following questions.
A. Create the network diagram representing the problem.
B. What is the total time expected to be required to complete
the project if no delays occur?
C. What are the earliest and latest start and finish times for
the individual activities required to meet the expected project
completion time provided in question B (show your method for
determining this)?
D. Which are...
 Answer these questions for the following simple set of project tasks. Task times are shown in hours w a. What is the expected time that all five tasks will be completed? Expected time 20 hours b. What is the earliest start for task C? Earliest startſ 4th/nd hour c. What is the latest start for task A? Latest start 1 nd/st hour
 HW12: Project Mgmt。 Saved Problem 15-4 Answer these questions for the following simple set of project tasks. Task times are shown in hours. Skipped eBook Print References a. What is the length of the critical path? 1hou Length of thecriticalpath「 b. What are the earliest start and latest start for E? points Earliest start th/nd hour Latest stat thind hour Sklpped eBook Print References c. What is the latest start for B? test stat th/nd hour d. If all other...
 5. For the following project digraph (processing times are in hours), please use the Backflow Process to find the critical time of each task, and list these in brackets. Then use the critical Path Algorithm (CPA) to find a work schedule for 3 processors, and state the Project Length and the Total Idle Time. (17 points) Project Digraph (10)[ ] 36(4)[]y, S col DAB ]0(1)(I HO ] 266] [volg? SEC)1-518)[] Z46)L]SENDLO) F (12) []J (10) [] MB][]> [0] CPA Work...
 Given is a PERT project network diagram as shown below: Start End ctivity |StarA KEnd 15 me 10 13 12 20 a) The Project Completion time = b) The Earliest Start time, ES, of Activity F- c) The Earliest Start time, ES, of Activity K = d) The Latest Start time, LS, of Activity. E = e) The non-critical activities are comma, no space) (ex. type in critical activities as ABCD, no
 The table below shows the output from a system that uses PERT for project scheduling. The project involves 12 interdependent activities and all times are reported in weeks. Based on the information provided, answer the following questions: IMMEDIATE EXPECTED ACTIVITY PREDECESSORS TIME EARLIEST EARLIEST LATEST LATEST START FINISH START FINISH 16 BNS lolos 12 4 31 28 43 32 10 6 38 D, J, K (a) What is the minimum expected time required to complete the project? (b) How is...
 CHAPTER 13 / Developing and implementing Effective Accounting Information Systems 431 14 FIGURE 13-11 PERT network diagram for a systems implementation project. 1 2 3 4 5 6 7 8 9 10 11 12 13 14 15 16 17 18 19 20 21 22 23 24 25 26 27 28 29 30 31 32 33 34 35 36 37 Activity Prepare the Physical site 3958 Determine functional changes Select and assign personnel Train personnel Acquire and install computer equipment Establish...
 16) A partially solved PERT problem is detailed in the table below. Times are given in weeks. Optimisti Activity Preceding Time Probable Pessimistie Expected Time Time Time Variance 10 8 19 20 - 니다 4-ww0 8 16 14 1 2.79 276 G + - 5 (a) Calculate the expected time and variance for each activity. Enter these values in the appropriate columns in the table above. (b) Which activities form the critical path? (c) What is the estimated time of...
 please answer from a until i with the solving steps
CHAPTER 13 / Developing and implementing Effective Accounting Information Systems 431 14 FIGURE 13-11 PERT network diagram for a systems implementation project. 13-19. Do you understand PERT charts? Refer back to Figure 13-11 and answer the following questions: a. Which activity or activities must be completed before activity C can begin? b. Which activity or activities must be completed before activity G can begin? c. Which activity or activities must...
please answer from a until i with the solving steps
CHAPTER 13 / Developing and implementing Effective Accounting Information Systems 431 14 FIGURE 13-11 PERT network diagram for a systems implementation project. 13-19. Do you understand PERT charts? Refer back to Figure 13-11 and answer the following questions: a. Which activity or activities must be completed before activity C can begin? b. Which activity or activities must be completed before activity G can begin? c. Which activity or activities must...
 Given all the information in the table, use PERT/CPM to help Mr.
Hawthorne address to the following questions.
A. Create the network diagram representing the problem.
B. What is the total time expected to be required to complete
the project if no delays occur?
C. What are the earliest and latest start and finish times for
the individual activities required to meet the expected project
completion time provided in question B (show your method for
determining this)?
D. Which are...
Given all the information in the table, use PERT/CPM to help Mr.
Hawthorne address to the following questions.
A. Create the network diagram representing the problem.
B. What is the total time expected to be required to complete
the project if no delays occur?
C. What are the earliest and latest start and finish times for
the individual activities required to meet the expected project
completion time provided in question B (show your method for
determining this)?
D. Which are...
Most questions answered within 3 hours.
-
7. Your grandfather left an inheritance for you of $50,000.
However you can only drawdown on...
asked 17 minutes ago -
An assumption of Theory X is that: Question 2 options: people
can exercise self-direction and self-control...
asked 16 minutes ago -
What is Polanyi's critique of Smith and economic liberalism?
asked 20 minutes ago -
Calculate the pH and the equilibrium concentrations of
H2C6H5O7-, HC6H5O72- and C6H5O73- in a 0.1840 M...
asked 28 minutes ago -
How many moles of copper II ion, Cu2+, are present in 200 mL of
a .250...
asked 32 minutes ago -
Use the properties of Boolean Algebra to reduce the following
Boolean expression to the simplest form...
asked 33 minutes ago -
This picture is a visual representation of helium. Write the
chemical formula for helium.
asked 35 minutes ago -
1. Sample Mean:
mens- 27.91
women - 31.57
2. Standard Deviation
men- 0.664
women- 1.167
Sample...
asked 45 minutes ago -
Needs Help with Java Programming language!
Lights Camera
Action Purpose: To learn the basics of linked...
asked 43 minutes ago -
Please answer my questions:
True or False and Explain
5)In a perfectly competitive market, if price...
asked 48 minutes ago -
Suppose the interest on a foreign government bonds is 7.5%, and
the current exchange rate is...
asked 49 minutes ago -
Explain why it is important to know common Windows processes
when conducting a forensic investigation
asked 55 minutes ago