

Homework Answers
Add Answer to:
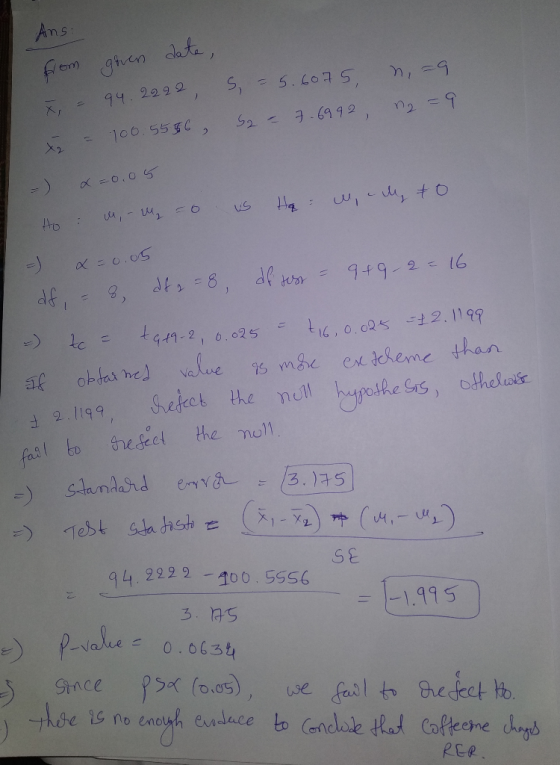
A study of the effect of caffeine on muscle metabolism used 18 male volunteers who each...
A researcher in interested in whether students who are musicians have higher intelligence test sc...
 A researcher in interested in whether students who are musicians have higher intelligence test scores than students in the general population. The mean for the general population is 100. The researcher selects musicians from local high schools and gives them an intelligence test, with a mean of 105. SS 725 for the 2. 30 sample Null Hypothesis (Ho): μ State in words: Alternative Hypothesis (Ha): μ > State in words: df= t critical value (with α : .05): One-tailed or...
Opinions about whether caffeine enhances test performance differ. You design a study to test the impact...
 Opinions about whether caffeine enhances test performance differ. You design a study to test the impact of drinks with different caffeine contents on students' test-taking abilities. You choose 21 students at random from your introductory psychology course to participate in your study. You randomly assign each student to one of three drinks, each with a different caffeine concentration, such that there are seven students assigned to each drink. You then give each of them a plain capsule containing the precise...
5. Hypothesis testing with ANOVA Aa Aa E Opinions about whether caffeine enhances test performance differ....
 5. Hypothesis testing with ANOVA Aa Aa E Opinions about whether caffeine enhances test performance differ. You design a study to test the impact of drinks with different caffeine contents on students' test-taking abilities. You choose 21 students at random from your introductory psychology course to participate in your study. You randomly assign each student to one of three drinks, each with a different caffeine concentration, such that there are seven students assigned to each drink. You then give each...
please help with t test snd hypothesesis If we reject a null hypothesis at the 1%...
 please help with t test snd hypothesesis
If we reject a null hypothesis at the 1% significance level, then we have hypothesis is false. evidence that the null For this problem create your own t-test and state your null hypothesis, alternative hypothesis Draw out the normal distribution curve and the critical region. You can assume a two tail test. Label the critical region. strong weak non existent
please help with t test snd hypothesesis
If we reject a null hypothesis at the 1% significance level, then we have hypothesis is false. evidence that the null For this problem create your own t-test and state your null hypothesis, alternative hypothesis Draw out the normal distribution curve and the critical region. You can assume a two tail test. Label the critical region. strong weak non existent
Match each step on the left with the procedure at that step on the right. Step Todo C1 a. identify test type and releva...
 Match each step on the left with the procedure at that step on the right. Step Todo C1 a. identify test type and relevant statistic b. write conclusion g92 † 93 e 94 695 a 96 d97 C. reject or fail to reject null d. draw graph showing test statistic critical value and critical region e. write null and alternative hypotheses f. write claim symbolically g. calculate test statistic Match each step on the left with the procedure at that...
3) Suppose you are an educational researcher who wishes to examine the effect of a school...
 3) Suppose you are an educational researcher who wishes to examine the effect of a school district's class size on its student achievement. Specifically, you are interested in whether in the U.S., on average, school districts with smaller class sizes perform differently on test scores than school districts with larger class sizes. To test this, you have conducted two surveys. The first survey randomly sampled 238 school districts with small class sizes. This survey found a sample average test score...
In a survey of 180 females who recently completed high school, 75% were enrolled in college....
 In a survey of 180 females who recently completed high school, 75% were enrolled in college. In a survey of 160 males who recently completed high school, 65% were enrolled in college. Atc=0.06, can you reject the claim that there is no difference in the proportion of college enrollees between the two groups? Assume the random samples are independent. Complete parts (a) through (e) (a) Identify the claim and state Ho and H. The claim is the proportion of female...
2. The following data were obtained in a su wine data were obtained in a study...
 2. The following data were obtained in a su wine data were obtained in a study comparing persons with disabilities with persons without ies. A scale known as the Barriers to Health Promotion Activities for Disabled Persons (BHADP) Scale data. We believe that persons with disabilities score higher than persons without disabilities. Test the hypothesis at a 0.01 Disabled: -35.63 - 129 * = 6.85 Nondisabled: 28.85 ,- 132 5,= 4.46 a. State the null and alternative hypothesis. H :...
The Student's t distribution table gives critical values for the Student's t distribution. Use an appropriate...
The Student's t distribution table gives critical values for the Student's t distribution. Use an appropriate d.f. as the row header. For a right-tailed test, the column header is the value of α found in the one-tail area row. For a left-tailed test, the column header is the value of α found in the one-tail area row, but you must change the sign of the critical value t to −t. For a two-tailed test, the column header is the value...
 A researcher in interested in whether students who are musicians have higher intelligence test scores than students in the general population. The mean for the general population is 100. The researcher selects musicians from local high schools and gives them an intelligence test, with a mean of 105. SS 725 for the 2. 30 sample Null Hypothesis (Ho): μ State in words: Alternative Hypothesis (Ha): μ > State in words: df= t critical value (with α : .05): One-tailed or...
 Opinions about whether caffeine enhances test performance differ. You design a study to test the impact of drinks with different caffeine contents on students' test-taking abilities. You choose 21 students at random from your introductory psychology course to participate in your study. You randomly assign each student to one of three drinks, each with a different caffeine concentration, such that there are seven students assigned to each drink. You then give each of them a plain capsule containing the precise...
 Opinions about whether caffeine enhances test performance differ. You design a study to test the impact of drinks with different caffeine contents on students' test-taking abilities. You choose 21 students at random from your introductory psychology course to participate in your study. You randomly assign each student to one of three drinks, each with a different caffeine concentration, such that there are seven students assigned to each drink. You then give each of them a plain capsule containing the precise...
 5. Hypothesis testing with ANOVA Aa Aa E Opinions about whether caffeine enhances test performance differ. You design a study to test the impact of drinks with different caffeine contents on students' test-taking abilities. You choose 21 students at random from your introductory psychology course to participate in your study. You randomly assign each student to one of three drinks, each with a different caffeine concentration, such that there are seven students assigned to each drink. You then give each...
 please help with t test snd hypothesesis
If we reject a null hypothesis at the 1% significance level, then we have hypothesis is false. evidence that the null For this problem create your own t-test and state your null hypothesis, alternative hypothesis Draw out the normal distribution curve and the critical region. You can assume a two tail test. Label the critical region. strong weak non existent
please help with t test snd hypothesesis
If we reject a null hypothesis at the 1% significance level, then we have hypothesis is false. evidence that the null For this problem create your own t-test and state your null hypothesis, alternative hypothesis Draw out the normal distribution curve and the critical region. You can assume a two tail test. Label the critical region. strong weak non existent
 Match each step on the left with the procedure at that step on the right. Step Todo C1 a. identify test type and relevant statistic b. write conclusion g92 † 93 e 94 695 a 96 d97 C. reject or fail to reject null d. draw graph showing test statistic critical value and critical region e. write null and alternative hypotheses f. write claim symbolically g. calculate test statistic Match each step on the left with the procedure at that...
 3) Suppose you are an educational researcher who wishes to examine the effect of a school district's class size on its student achievement. Specifically, you are interested in whether in the U.S., on average, school districts with smaller class sizes perform differently on test scores than school districts with larger class sizes. To test this, you have conducted two surveys. The first survey randomly sampled 238 school districts with small class sizes. This survey found a sample average test score...
 In a survey of 180 females who recently completed high school, 75% were enrolled in college. In a survey of 160 males who recently completed high school, 65% were enrolled in college. Atc=0.06, can you reject the claim that there is no difference in the proportion of college enrollees between the two groups? Assume the random samples are independent. Complete parts (a) through (e) (a) Identify the claim and state Ho and H. The claim is the proportion of female...
 2. The following data were obtained in a su wine data were obtained in a study comparing persons with disabilities with persons without ies. A scale known as the Barriers to Health Promotion Activities for Disabled Persons (BHADP) Scale data. We believe that persons with disabilities score higher than persons without disabilities. Test the hypothesis at a 0.01 Disabled: -35.63 - 129 * = 6.85 Nondisabled: 28.85 ,- 132 5,= 4.46 a. State the null and alternative hypothesis. H :...
Most questions answered within 3 hours.
-
The value of the equilibrium constant Kc for the reaction
N2(g)+3H2(g)⇌2NH3(g) changes in the following manner...
asked 3 minutes ago -
There are two flasks on the bench top, one flask contains a 0.50
M NaCl solution...
asked 8 minutes ago -
Which of the following aqueous solutions are good buffer
systems?
.
0.10 M hydrofluoric acid +...
asked 10 minutes ago -
2. An S election is terminated if the S corporation has passive
investment income in excess...
asked 12 minutes ago -
Part of an ANOVA table is shown below.
Source of
Variation
Sum of
Squares
Degrees of...
asked 28 minutes ago -
Business process improvement initiatives often include
introducing new technology to support the new or changed ways...
asked 35 minutes ago -
Review your choice of either Agile or the Waterfall models and
for each of the 22...
asked 36 minutes ago -
Suppose an x distribution has mean μ = 4.
Consider two corresponding
x
distributions, the first...
asked 38 minutes ago -
A study of the effects of exercise used rats bred to have high
or low capacity...
asked 1 hour ago -
Using your data from the experiment, calculate the initial moles
of HCl that you started with....
asked 1 hour ago -
Suppose you want to make 500 mL of a 0.20 M Tris buffer at pH
8.0....
asked 1 hour ago -
The titanic hit an iceberg estimated to be half of her mass.
Before hitting the iceberg,...
asked 1 hour ago