


Homework Answers
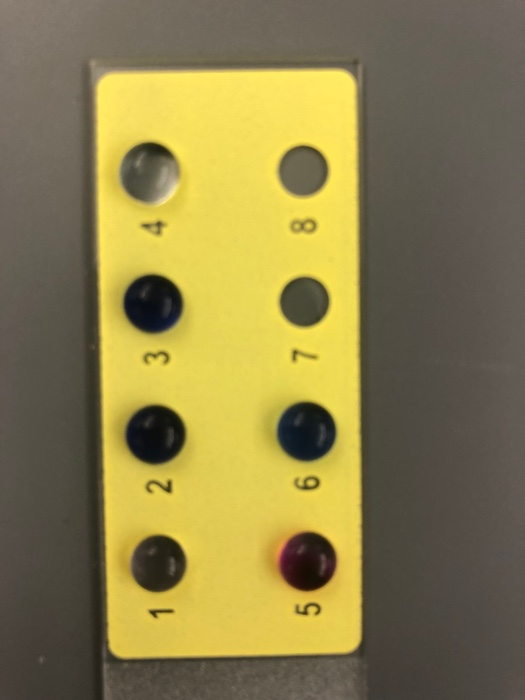
1. Genes 2, 3 and 4 are repressed in the lung cancer as the color readout is neither purple nor red.
Gene 6 is expressed in both the cells as purple color is read from the cDNA.
3. The blue color is mostly seen in most of the published microarray experiments indicating that the expression of normal lungs is abundant when compared to cancer lung.
4. Gene 5 showed increased transcription in the lung cancer cells as the cDNA labeled with Cy5 is read.
5. Genes 1, 2, 3, 4 and 6 are repressed in lung cancer cells. This is evident by the absence of red color in 1, 2, 3, and 6 whereas in 4 grey or black color indicate the absence of expression in both normal and cancer lung cells.
6. From the slide microarray, it can be observed that gene 4 is not expressed in either of the cell types. This indicates the lack of expression of the gene at the mRNA level or the gene might have deleted at the DNA level.

Add Answer to:
please help
table 1 , Question 1 and 10
procedure is done which is the color...
In DNA sequencing, ddNTPs differ from dNTPs in that ddNTPs are lacking a OH at the...
 In DNA sequencing, ddNTPs differ from dNTPs in that ddNTPs are
lacking a OH at the
a.
2' carbon
b.
5' carbon
c.
3' carbon
please answer as many as you can!! I am low on questions and
could use the help!
Mother || Child II Male 1 Male 2 Results from a paternity test using DNA fingerprinting is shown. DNA was isolated from a mother, her child and 2 potential fathers. Primers designed to amplify different satellite DNA regions...
In DNA sequencing, ddNTPs differ from dNTPs in that ddNTPs are
lacking a OH at the
a.
2' carbon
b.
5' carbon
c.
3' carbon
please answer as many as you can!! I am low on questions and
could use the help!
Mother || Child II Male 1 Male 2 Results from a paternity test using DNA fingerprinting is shown. DNA was isolated from a mother, her child and 2 potential fathers. Primers designed to amplify different satellite DNA regions...
Tissue-specific microarray analysis facilitates the comparison of gene expression in different tissues. In order to prepare...
 Tissue-specific microarray analysis facilitates the comparison
of gene expression in different tissues. In order to prepare a
sample for microarray analysis, messenger RNA (mRNA) is extracted
from a particular tissue, reverse transcribed to generate
complementary DNA (cDNA), and labeled with a fluorescent probe.
The microarray below shows comparison of gene expression in
stomach and intestinal tissues. The cDNA from stomach tissue was
labeled with red fluorescent probes, whereas the cDNA from the
intestinal tissue was labeled with green fluorescent probes....
Tissue-specific microarray analysis facilitates the comparison
of gene expression in different tissues. In order to prepare a
sample for microarray analysis, messenger RNA (mRNA) is extracted
from a particular tissue, reverse transcribed to generate
complementary DNA (cDNA), and labeled with a fluorescent probe.
The microarray below shows comparison of gene expression in
stomach and intestinal tissues. The cDNA from stomach tissue was
labeled with red fluorescent probes, whereas the cDNA from the
intestinal tissue was labeled with green fluorescent probes....
You are conducting a microarray experiment with yeast cells and have labeled the cDNAs generated from...
 You are conducting a microarray experiment with yeast cells and have labeled the cDNAs generated from cells grown under normal condition (N) with a red dye and the cDNAs generated from the same cell line after the cells were subjected to a stress (S) with a green dye. For gene spot 15, you observe that the color was red, what does that mean? A. The number of chromosomes per cell with gene 15 was higher after stress (S) B. The...
i need help on 10a ,b,c,d Paragraph Styles Figure 1. Color Intensity chart Ratios 16 1/8...
 i need help on 10a ,b,c,d
Paragraph Styles Figure 1. Color Intensity chart Ratios 16 1/8 1/16 Table 1 Gene 2 Gene 3 Gene 4 Gene 5 Gene 6 Gene 1 8 Expression 1/8 16 1/4 Ratio Decimal Value Log: Value D. Focu o E G = = L L L W T JUUUUUCCI C. 10. Using the data from Table 1 for the microarray color intensity values. (0.5pt each) a. What range of log transformed values would indicate that...
i need help on 10a ,b,c,d
Paragraph Styles Figure 1. Color Intensity chart Ratios 16 1/8 1/16 Table 1 Gene 2 Gene 3 Gene 4 Gene 5 Gene 6 Gene 1 8 Expression 1/8 16 1/4 Ratio Decimal Value Log: Value D. Focu o E G = = L L L W T JUUUUUCCI C. 10. Using the data from Table 1 for the microarray color intensity values. (0.5pt each) a. What range of log transformed values would indicate that...
depaniak Bio 152-05 W17 Signed in as sama alsaady nze Homework scientific Thinking: Can Gene Expression...
 depaniak Bio 152-05 W17 Signed in as sama alsaady nze Homework scientific Thinking: Can Gene Expression Data Help Scientists Develop Persona 6 of 7 Part A Interpreting data Patients in Group I Patients in Group II In this activity, you will explore how DNA microarrays are being used as a tool forstudying-andpossibly treating-cancer. The data shown here were obtained from aDNA microarray study of gene expression pattems in 16 cancer patients. Although data for many more genes were obtained from...
someone please help! i have a brain fart :/ tations and Regulation of Gene Expression 6....
 someone please help! i have a brain fart :/
tations and Regulation of Gene Expression 6. Which of the following statements about the DNA in your brain cells is TRUE? a. The majority of the DNA in these cells is made up of genes that code for proteins. b. The majority of genes in these cells are expressed as RNA or proteins. C. Your brain cells contain approximately the same DNA as your heart cells. d. All of the above...
someone please help! i have a brain fart :/
tations and Regulation of Gene Expression 6. Which of the following statements about the DNA in your brain cells is TRUE? a. The majority of the DNA in these cells is made up of genes that code for proteins. b. The majority of genes in these cells are expressed as RNA or proteins. C. Your brain cells contain approximately the same DNA as your heart cells. d. All of the above...
please answer all the question to get a like. Part III Dr. Hernandez sits down with...
please answer all the question to get a like. Part III Dr. Hernandez sits down with Ann and her partner. The doctor is sorry to report that Ann has breast cancer; however, because it was caught early and responds to estrogen and progesterone, the prognosis is good. At this point it looks like the cancer is stage 1. However, as Ann is young, the doctor wants to perform a couple of tests. The first test is a genetic sequencing test...
Please help 15. During our paper lab experiment, we compared the tumor cells from one patient...
 Please help
15. During our paper lab experiment, we compared the tumor cells from one patient to the normal cells of the same patient. If we wanted to do a larger study to give a larger picture of what is going on in colon cancer cells which of the following would be a better way to set up the experiment? A. Collect cancer cells and normal cells from 1000 patients and run 1000 different microarrays (one for each person) and...
Please help
15. During our paper lab experiment, we compared the tumor cells from one patient to the normal cells of the same patient. If we wanted to do a larger study to give a larger picture of what is going on in colon cancer cells which of the following would be a better way to set up the experiment? A. Collect cancer cells and normal cells from 1000 patients and run 1000 different microarrays (one for each person) and...
90170021 201901/P53 pd 8. (3) Lator you find out that you have access to a microarray...
 90170021 201901/P53 pd 8. (3) Lator you find out that you have access to a microarray for 10 gones that are associated with John's type of cancer. The microarray was done comparing normal tissue the microarray are shown below. One of the patients is John sequence of proteins. What are these mutations? How do the mutations change the 9. (2) If you were to suggest gene therapy to the family. how you describe what the main goal of this therapy...
This discussion focuses on the regulation of glycolysis and gluconeogenesis by phosphofructokinase-2 and will help you...
 This discussion focuses on the regulation of glycolysis and
gluconeogenesis by phosphofructokinase-2 and will help you apply
your understanding of these pathways and their regulation to
adaptations in cancerous cells.
You have successfully completed your internship rotation
with the antibiotic group at
MethylTranspharmiX and have moved into
their Cancer Therapeutics division.
In many cancers, cells use aerobic glycolysis rather than
oxidative phosphorylation as their main energy source. This is
known as the Warburg effect, and was first described by Otto...
This discussion focuses on the regulation of glycolysis and
gluconeogenesis by phosphofructokinase-2 and will help you apply
your understanding of these pathways and their regulation to
adaptations in cancerous cells.
You have successfully completed your internship rotation
with the antibiotic group at
MethylTranspharmiX and have moved into
their Cancer Therapeutics division.
In many cancers, cells use aerobic glycolysis rather than
oxidative phosphorylation as their main energy source. This is
known as the Warburg effect, and was first described by Otto...
 In DNA sequencing, ddNTPs differ from dNTPs in that ddNTPs are
lacking a OH at the
a.
2' carbon
b.
5' carbon
c.
3' carbon
please answer as many as you can!! I am low on questions and
could use the help!
Mother || Child II Male 1 Male 2 Results from a paternity test using DNA fingerprinting is shown. DNA was isolated from a mother, her child and 2 potential fathers. Primers designed to amplify different satellite DNA regions...
In DNA sequencing, ddNTPs differ from dNTPs in that ddNTPs are
lacking a OH at the
a.
2' carbon
b.
5' carbon
c.
3' carbon
please answer as many as you can!! I am low on questions and
could use the help!
Mother || Child II Male 1 Male 2 Results from a paternity test using DNA fingerprinting is shown. DNA was isolated from a mother, her child and 2 potential fathers. Primers designed to amplify different satellite DNA regions...
 Tissue-specific microarray analysis facilitates the comparison
of gene expression in different tissues. In order to prepare a
sample for microarray analysis, messenger RNA (mRNA) is extracted
from a particular tissue, reverse transcribed to generate
complementary DNA (cDNA), and labeled with a fluorescent probe.
The microarray below shows comparison of gene expression in
stomach and intestinal tissues. The cDNA from stomach tissue was
labeled with red fluorescent probes, whereas the cDNA from the
intestinal tissue was labeled with green fluorescent probes....
Tissue-specific microarray analysis facilitates the comparison
of gene expression in different tissues. In order to prepare a
sample for microarray analysis, messenger RNA (mRNA) is extracted
from a particular tissue, reverse transcribed to generate
complementary DNA (cDNA), and labeled with a fluorescent probe.
The microarray below shows comparison of gene expression in
stomach and intestinal tissues. The cDNA from stomach tissue was
labeled with red fluorescent probes, whereas the cDNA from the
intestinal tissue was labeled with green fluorescent probes....
 You are conducting a microarray experiment with yeast cells and have labeled the cDNAs generated from cells grown under normal condition (N) with a red dye and the cDNAs generated from the same cell line after the cells were subjected to a stress (S) with a green dye. For gene spot 15, you observe that the color was red, what does that mean? A. The number of chromosomes per cell with gene 15 was higher after stress (S) B. The...
 i need help on 10a ,b,c,d
Paragraph Styles Figure 1. Color Intensity chart Ratios 16 1/8 1/16 Table 1 Gene 2 Gene 3 Gene 4 Gene 5 Gene 6 Gene 1 8 Expression 1/8 16 1/4 Ratio Decimal Value Log: Value D. Focu o E G = = L L L W T JUUUUUCCI C. 10. Using the data from Table 1 for the microarray color intensity values. (0.5pt each) a. What range of log transformed values would indicate that...
i need help on 10a ,b,c,d
Paragraph Styles Figure 1. Color Intensity chart Ratios 16 1/8 1/16 Table 1 Gene 2 Gene 3 Gene 4 Gene 5 Gene 6 Gene 1 8 Expression 1/8 16 1/4 Ratio Decimal Value Log: Value D. Focu o E G = = L L L W T JUUUUUCCI C. 10. Using the data from Table 1 for the microarray color intensity values. (0.5pt each) a. What range of log transformed values would indicate that...
 depaniak Bio 152-05 W17 Signed in as sama alsaady nze Homework scientific Thinking: Can Gene Expression Data Help Scientists Develop Persona 6 of 7 Part A Interpreting data Patients in Group I Patients in Group II In this activity, you will explore how DNA microarrays are being used as a tool forstudying-andpossibly treating-cancer. The data shown here were obtained from aDNA microarray study of gene expression pattems in 16 cancer patients. Although data for many more genes were obtained from...
 someone please help! i have a brain fart :/
tations and Regulation of Gene Expression 6. Which of the following statements about the DNA in your brain cells is TRUE? a. The majority of the DNA in these cells is made up of genes that code for proteins. b. The majority of genes in these cells are expressed as RNA or proteins. C. Your brain cells contain approximately the same DNA as your heart cells. d. All of the above...
someone please help! i have a brain fart :/
tations and Regulation of Gene Expression 6. Which of the following statements about the DNA in your brain cells is TRUE? a. The majority of the DNA in these cells is made up of genes that code for proteins. b. The majority of genes in these cells are expressed as RNA or proteins. C. Your brain cells contain approximately the same DNA as your heart cells. d. All of the above...
 Please help
15. During our paper lab experiment, we compared the tumor cells from one patient to the normal cells of the same patient. If we wanted to do a larger study to give a larger picture of what is going on in colon cancer cells which of the following would be a better way to set up the experiment? A. Collect cancer cells and normal cells from 1000 patients and run 1000 different microarrays (one for each person) and...
Please help
15. During our paper lab experiment, we compared the tumor cells from one patient to the normal cells of the same patient. If we wanted to do a larger study to give a larger picture of what is going on in colon cancer cells which of the following would be a better way to set up the experiment? A. Collect cancer cells and normal cells from 1000 patients and run 1000 different microarrays (one for each person) and...
 90170021 201901/P53 pd 8. (3) Lator you find out that you have access to a microarray for 10 gones that are associated with John's type of cancer. The microarray was done comparing normal tissue the microarray are shown below. One of the patients is John sequence of proteins. What are these mutations? How do the mutations change the 9. (2) If you were to suggest gene therapy to the family. how you describe what the main goal of this therapy...
 This discussion focuses on the regulation of glycolysis and
gluconeogenesis by phosphofructokinase-2 and will help you apply
your understanding of these pathways and their regulation to
adaptations in cancerous cells.
You have successfully completed your internship rotation
with the antibiotic group at
MethylTranspharmiX and have moved into
their Cancer Therapeutics division.
In many cancers, cells use aerobic glycolysis rather than
oxidative phosphorylation as their main energy source. This is
known as the Warburg effect, and was first described by Otto...
This discussion focuses on the regulation of glycolysis and
gluconeogenesis by phosphofructokinase-2 and will help you apply
your understanding of these pathways and their regulation to
adaptations in cancerous cells.
You have successfully completed your internship rotation
with the antibiotic group at
MethylTranspharmiX and have moved into
their Cancer Therapeutics division.
In many cancers, cells use aerobic glycolysis rather than
oxidative phosphorylation as their main energy source. This is
known as the Warburg effect, and was first described by Otto...
Most questions answered within 3 hours.
-
For the balanced reaction: CaCl2 (aq) + Na2CO3 (aq) -> CaCO3
(s) + 2 NaCl (aq),...
asked 3 minutes ago -
1. If ln(x)=ln(x)= -0.2 , what does xx equal? Round
your answer to three significant figures. The...
asked 6 seconds ago -
what is the current research being done on the hexokinase
enzyme?
asked 6 minutes ago -
An incline weighing 1,106 kg with its passengers travels uphill
800 meters on a 30 degree...
asked 6 minutes ago -
Let’s assume you want to retire with $1,000,000 in your
investment portfolio. Given that your investment...
asked 6 minutes ago -
profit motivation is one of the biggest differences between
public and private organizations. what about resource...
asked 5 minutes ago -
Test the hypothesis using P-value approach. Be sure to verify
the requirements of the test.
H0:...
asked 8 minutes ago -
Balance the following oxidation-reduction equations using redox
methods:
Cu + H+ --------> Cu+ +
H2
asked 9 minutes ago -
Baltimore Manufacturing had a Work in Process balance of $84,000
on January 1, 2018. The year...
asked 13 minutes ago -
Need help converting into sql language.
How many players from each town served on the committee...
asked 25 minutes ago -
A professor needs to assign 15 teaching assistants to the course
STATISTICS 101. There are 40...
asked 27 minutes ago -
A palindrome is a word, phrase, number, or other sequence of
characters which reads the same...
asked 19 minutes ago