Use a PERT network to establish the expected duration for the project described in the table...
Use a PERT network to establish the expected duration for the project described in the table below: (SHOW the PERT NETWORK)
|
Activity |
Predecessors |
Duration a m b |
Exp. Duration |
Var. |
Crash Week 1 |
Crash Week 2 |
|||
|
A |
- |
3 |
6 |
9 |
700 |
100 |
|||
|
B |
A |
6 |
7 |
14 |
600 |
200 |
|||
|
C |
A |
4 |
6 |
14 |
400 |
600 |
|||
|
D |
B, C |
4 |
6 |
8 |
200 |
|
600 |
||
|
E |
B, C |
6 |
9 |
12 |
400 |
300 |
|||
|
F |
C |
4 |
6 |
14 |
200 |
900 |
|||
|
G |
D, E |
3 |
5 |
7 |
400 |
400 |
|||
|
H |
E |
3 |
6 |
9 |
600 |
100 |
|||
|
I |
G |
8 |
8 |
8 |
600 |
||||
|
J |
H |
4 |
10 |
16 |
700 |
300 |
|||
a. List the activities on the CRITICAL PATH:………………………
b. What is the project expected duration?...........
c. In your table list ALL expected durations and ALL variances.
d. List is the slack for: J …….. I ……… F………. C ………
e. List the latest starting time for: G …….. F ……… E ……….
f. The company indicated that they need to have a 90% probability of completing in 39 weeks.
What will become of the expected duration to make sure that we meet the 90% probability to
complete within 39 weeks?......................
g. Because of the new expected duration, (see f), how many weeks are to be crashed?.............
h. List specifically which activities you would crash, and for how many weeks:
|
Activity |
# Weeks |
Crashing Cost |
Homework Answers
We will use below approach for Slack and Late finish as well as validating critical path and project duration.
Earliest Start Time (ES) = the earliest time that an activity can begin
Earliest Finish Time (EF) = the earliest time that an activity can be completed
EF = ES + duration of activity
Latest Start Time (LS) = the latest time that an activity can begin without lengthening the minimum project duration
Latest Finish Time (LF) = the earliest time than an activity can be completed without lengthening the minimum project duration
LF = LS + duration of activity
Duration of the project = the difference between the maximum value of the "latest finish time" of projects and the minimum value of the "earliest start time" of projects
Project duration = max(LF) - min(ES)
Slack = the amount of time that a project can be delayed without increasing the duration of the project
Slack = LF- LS or EF - ES
Critical path is the path with Total Slack = 0
Calculations are below:
| Expected time = (Optimistic + 4*Most Likely + Pessimistic)/ 6 | ||||||||||||
| Variance = ((Pessimistic - Optimistic)/ 6)2 | ||||||||||||
| Activity | Predecessors | Duration | Exp. Duration | Variance | Early Start (ES) | Early Finish (EF) | Late Start (LS) | Late Finish (LF) | Slack | Critical Path | ||
| a | m | b | ||||||||||
| A | - | 3 | 6 | 9 | 6.0 | 1.00 | 0 | 6.0 | 0.0 | 6.0 | 0.0 | Y |
| B | A | 6 | 7 | 14 | 8.0 | 1.78 | 6.0 | 14.0 | 6.0 | 14.0 | 0.0 | Y |
| C | A | 4 | 6 | 14 | 7.0 | 2.78 | 6.0 | 13.0 | 7.0 | 14.0 | 1.0 | |
| D | B,C | 4 | 6 | 8 | 6.0 | 0.44 | 14.0 | 20.0 | 18.0 | 24.0 | 4.0 | |
| E | B,C | 6 | 9 | 12 | 9.0 | 1.00 | 14.0 | 23.0 | 14.0 | 23.0 | 0.0 | Y |
| F | C | 4 | 6 | 14 | 7.0 | 2.78 | 13.0 | 20.0 | 29.0 | 39 | 19.0 | |
| G | D,E | 3 | 5 | 7 | 5.0 | 0.44 | 23.0 | 28.0 | 24.0 | 29.0 | 1.0 | |
| H | E | 3 | 6 | 9 | 6.0 | 1.00 | 23.0 | 29.0 | 23.0 | 29.0 | 0.0 | Y |
| I | G | 8 | 8 | 8 | 8.0 | 0.00 | 28.0 | 36.0 | 29.0 | 39.0 | 3.0 | |
| J | H | 4 | 10 | 16 | 10.0 | 4.00 | 29.0 | 39.0 | 29.0 | 39.0 | 0.0 | Y |
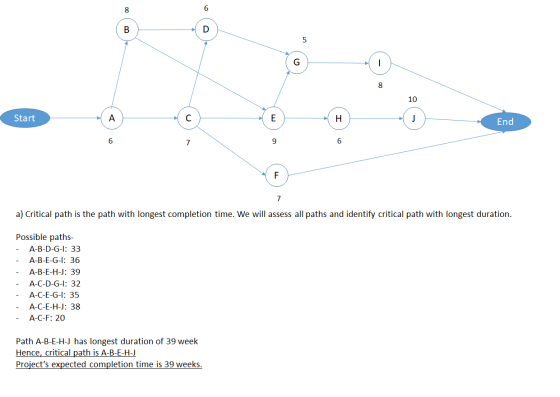
| a. Activities on Critical path is A-B-E-H-J | ||||||||||||
| b. Project expected duration is 39 weeks | ||||||||||||
| c. Table with expected duration and all variances ->> Updated above | ||||||||||||
| d. Slack: J=0, I=3, F=19, C=1 | ||||||||||||
| e. Latest starting time for G=24, F=29, E=14 | ||||||||||||
Variance of critical path = 1 + 1.78 +1 + 1+ 4 = 8.78
Standard deviation of critical path = √8.78 = 2.96
f)
For probability we will use z statistics,
Z= (X- Expected time)/ Standard deviation
For 90% probability, looking at z table as given below we will get z value of 1.29
Z= (X- Expected time)/ Standard deviation
1.29 = (39-Expected time)/ 2.96
Expected time = 35.18
Target expected duration to male sure that we meet 90% probability to complete within 39 weeks is 35.18 weeks. (~ 35 week rounded)
g.
To meet new expected duration, 4 weeks duration (approaximately) need to be crashed
(Earlier expected duration was 39 and now required is ~35 weeks)
h.
Now to crash project duration by 4 weeks, we will crash activities on critical path A-B-E-H-J starting with activities with lowest crashing cost.
- Activity E has lowest crashing cost for Week 1 (400), so we crash E by 1 week. New project duration is 39-1=38 weeks. Crashing cost is $400. Critical path is same A-B-E-H-J.
- Next we will crash activity E by second week (300).New project duration is 38-1=37 weeks. Crashing cost is $400+300=700. Critical path is same A-B-E-H-J.
- Next we will crash activity H by 1 Week (600). New project duration is 37-1=36 weeks. Crashing cost is $700+600=$1300. Critical path is same A-B-E-H-J.
- Next we will crash activity H by second Week (100). New project duration is 36-1=35 weeks. Crashing cost is $1300+100=$1400. Critical path is same A-B-E-H-J.
| Activity | # Weeks | Crashing Cost |
| E | 1 | 400 |
| E | 1 | 300 |
| H | 1 | 600 |
| H | 1 | 100 |
| 1400 |
So total $1400 of crashing cost is needed to reduce project duration to 35 weeks.
Please give thumbs up/ likes if you find this answer helpful. Thank
you!

Add Answer to:
Use a PERT network to establish the expected duration for the
project described in the table...
Question 2. (30%) The following table provides the information necessary to construct project network and calculate...
Question 2. (30%) The following table provides the information necessary to construct project network and calculate a total project cost. In case of activity crash, the information includes crash cost for each activity. Activity Immediate predecessor(s) Activity time (weeks) Normal cost (x1000$) Additional cost for crashing one week (x1000$) Normal After maximum crash A - 16 12 2,000 300 B - 14 9 1,000 160 C A 8 6 500 100 D A 5 4 600 700 E B 4...
The table below defines the activities and the normal time duration for each activities within a...
The table below defines the activities and the normal time duration for each activities within a small project. You can decrease (crash) the durations at an additional expense. Table 1 summarizes the time-cost information for the activities to complete the project. Table 1: The time-cost information for the activities Activity Normal Completion Time (weeks) Immediate Predecessor Crash Time (weeks) Normal cost for activities Crash cost for activities/week A 2 - 1 1200 400 B 3 - 1 1400 500 C...
: A network consists of the following list. Times are given in weeks. Activity Preceding Duration...
: A network consists of the following list. Times are given in weeks. Activity Preceding Duration A -- 9 B A 2 C A 12 D A 5 E B 6 F B 8 G C, F 3 H D 2 I H 8 J G, I 6 K E, J 2 Draw the network diagram. Find ES, EF, LS, LF, and the slack times for each of the activities. Which activities are critical? Determine the critical path(s). What is...
A partially solved PERT problem is detailed in the table below. Times are given in weeks....
A partially solved PERT problem is detailed in the table below. Times are given in weeks. Activity Preceding Optimistic Time Probable Time Pessimistic Time Expected Time Variance A -- 7 9 14 1.361 B A 2 2 8 0 C A 8 12 16 0 D A 3 5 10 1.361 E B 4 6 8 0 F B 6 8 10 0 G C, F 2 3 4 0 H D 2 2 8 1.000 I H 6 8...
Given the data table below develop the precedence network and perform the CPM calculations. Then, using...
 Given the data table below develop the precedence network and perform the CPM calculations. Then, using the proposed crashing strategy calculate the normal, least-cost, and crash duration for the project below. Calculate the cost associated with each duration. Indirect cost (overhead) is $120 per day. Activity IPA Duration Cost $ Normal Crash Normal Crash A 5 4 $770 $900 3 2 B C P 7 4 $660 $700 $800 $1,070 $1,000 $1,110 $800 $920 D AB 4 3 E B...
For the project outlined on the following table, (a) draw a network diagram (arrow or PDM,...
 For the project outlined on the following table, (a) draw a
network diagram (arrow or PDM,
as you prefer), and (b) identify the critical path and duration.
(c) Identify the task(s) you
would crash and the incremental cost to reduce project duration by
(i) one week; (ii) a second
week; (iii) a third week.
Duration (Weeks) Cost (Dollars) Task Follows Task(s) Normal Crash Normal Crash (Start) (Start) A, B B C D uun $500 400 600 $600 450 750 550...
For the project outlined on the following table, (a) draw a
network diagram (arrow or PDM,
as you prefer), and (b) identify the critical path and duration.
(c) Identify the task(s) you
would crash and the incremental cost to reduce project duration by
(i) one week; (ii) a second
week; (iii) a third week.
Duration (Weeks) Cost (Dollars) Task Follows Task(s) Normal Crash Normal Crash (Start) (Start) A, B B C D uun $500 400 600 $600 450 750 550...
Consider a project having the following six activities:
Consider a project having the following six activities: Immediate Max Crash cost Activity Predecessors Time (weeks) Crash* per week A none 6 6 N/A B none 5 2 $500 C A 3 2 $1000 D A, B 4 2 $2000 E C, D 5 2 $1250 F D 6 2 $1000 *Shortest possible time for the task 1. Draw the project network and list...
Consider the project network information in Table 1 of Case Study A on Page 3 below....
 Consider the project network information in Table 1 of Case Study A on Page 3 below. Assuming the project starts at time zero and all activity connections are finish-to-start, draw an Activity on the Node (AON) network diagram of the project, determine the expected project completion time, state the critical activities and critical path(s). Crash the project by 1 week and state the total crash cost. (b) (18 nar Case Study A Table 1 below contains activities associated with a...
Consider the project network information in Table 1 of Case Study A on Page 3 below....
 Consider the project network information in Table 1 of Case Study A on Page 3 below. Assuming the project starts at time zero and all activity connections are finish-to-start, draw an Activity on the Node (AON) network diagram of the project, determine the expected project completion time, state the critical activities and critical path(s). Crash the project by 1 week and state the total crash cost. (b) (18 narl Case Study A Table 1 below contains activities associated with a...
2. Can the project be completed before construction can begin, which is scheduled 40 weeks later?...
 2.
Can the project be completed before construction can begin,
which is scheduled 40 weeks later?
a.
Yes, because the project duration time is 39 weeks.
b.
No, because the project duration time is 41 weeks.
c.
No, because the project duration time is 42 weeks.
d.
Yes, because the project duration time is 40 weeks.
3.
Which activities can be delayed without delaying the projection
completion time?
a.
B, D and F
b.
B, D and G
c.
A,...
2.
Can the project be completed before construction can begin,
which is scheduled 40 weeks later?
a.
Yes, because the project duration time is 39 weeks.
b.
No, because the project duration time is 41 weeks.
c.
No, because the project duration time is 42 weeks.
d.
Yes, because the project duration time is 40 weeks.
3.
Which activities can be delayed without delaying the projection
completion time?
a.
B, D and F
b.
B, D and G
c.
A,...
 Given the data table below develop the precedence network and perform the CPM calculations. Then, using the proposed crashing strategy calculate the normal, least-cost, and crash duration for the project below. Calculate the cost associated with each duration. Indirect cost (overhead) is $120 per day. Activity IPA Duration Cost $ Normal Crash Normal Crash A 5 4 $770 $900 3 2 B C P 7 4 $660 $700 $800 $1,070 $1,000 $1,110 $800 $920 D AB 4 3 E B...
 For the project outlined on the following table, (a) draw a
network diagram (arrow or PDM,
as you prefer), and (b) identify the critical path and duration.
(c) Identify the task(s) you
would crash and the incremental cost to reduce project duration by
(i) one week; (ii) a second
week; (iii) a third week.
Duration (Weeks) Cost (Dollars) Task Follows Task(s) Normal Crash Normal Crash (Start) (Start) A, B B C D uun $500 400 600 $600 450 750 550...
For the project outlined on the following table, (a) draw a
network diagram (arrow or PDM,
as you prefer), and (b) identify the critical path and duration.
(c) Identify the task(s) you
would crash and the incremental cost to reduce project duration by
(i) one week; (ii) a second
week; (iii) a third week.
Duration (Weeks) Cost (Dollars) Task Follows Task(s) Normal Crash Normal Crash (Start) (Start) A, B B C D uun $500 400 600 $600 450 750 550...
 Consider the project network information in Table 1 of Case Study A on Page 3 below. Assuming the project starts at time zero and all activity connections are finish-to-start, draw an Activity on the Node (AON) network diagram of the project, determine the expected project completion time, state the critical activities and critical path(s). Crash the project by 1 week and state the total crash cost. (b) (18 nar Case Study A Table 1 below contains activities associated with a...
 Consider the project network information in Table 1 of Case Study A on Page 3 below. Assuming the project starts at time zero and all activity connections are finish-to-start, draw an Activity on the Node (AON) network diagram of the project, determine the expected project completion time, state the critical activities and critical path(s). Crash the project by 1 week and state the total crash cost. (b) (18 narl Case Study A Table 1 below contains activities associated with a...
 2.
Can the project be completed before construction can begin,
which is scheduled 40 weeks later?
a.
Yes, because the project duration time is 39 weeks.
b.
No, because the project duration time is 41 weeks.
c.
No, because the project duration time is 42 weeks.
d.
Yes, because the project duration time is 40 weeks.
3.
Which activities can be delayed without delaying the projection
completion time?
a.
B, D and F
b.
B, D and G
c.
A,...
2.
Can the project be completed before construction can begin,
which is scheduled 40 weeks later?
a.
Yes, because the project duration time is 39 weeks.
b.
No, because the project duration time is 41 weeks.
c.
No, because the project duration time is 42 weeks.
d.
Yes, because the project duration time is 40 weeks.
3.
Which activities can be delayed without delaying the projection
completion time?
a.
B, D and F
b.
B, D and G
c.
A,...
Most questions answered within 3 hours.
-
The shape of both C=CF2 groups in tetrafluoroethene molecule
(F2C=CF2) is __________, and the shape of...
asked 10 minutes ago -
A mass M = 10.0 kg falls through a height h = 1.00 m, whilst
attached...
asked 28 minutes ago -
2 H3BO3 (aq) + 3 Ba(OH)2 (aq) ---> Ba3(BO3)2 (aq) + 6 H2O
48.76 mL of...
asked 30 minutes ago -
Consider the reaction. 2A(g)↽−−⇀B(g)?p=1.17×10⁻⁵at 500 K If a
sample of A(g) A ( g ) at...
asked 28 minutes ago -
1.
Cybercrime:
a.
has been controlled by comprehensive federal legislation.
b.
is easy to detect.
c....
asked 29 minutes ago -
The retail price of a medium-sized box of a well-known brand of
cornflakes ranges from $3.14...
asked 33 minutes ago -
You want to freeze some homemade popsicles. You pour 0.24 kg of
juice at room temperature...
asked 42 minutes ago -
In a Hall-effect experiment, a current of 2.2 A sent
lengthwise through a conductor 1.1 cm...
asked 47 minutes ago -
Life Insurance: A life insurance company wants
to estimate the probability that a 40-year-old male will...
asked 54 minutes ago -
Consider the fission reaction 23592U+n→13351Sb+9841Nb+?n. Part A
How many neutrons are produced in this reaction? Part...
asked 50 minutes ago -
Find the maximum of x in the bottom quartile. (Round your answer
to four decimal places.)...
asked 1 hour ago -
Which of the following computer languages is the easiest to
use?
A. Assembly language B. First-generation...
asked 58 minutes ago