4. A project has the following tasks and duration estimates given. These three tasks are done...
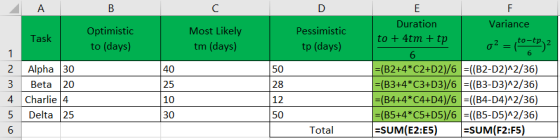
4. A project has the following tasks and duration estimates given. These three tasks are done in succession on a project. Task Optimistic Estimate Most Likely Estimate Pessimistic Estimate Alpha 30 days 40 days 50 days Beta 20 days 25 days 28 days Charlie 4 days 10 days 12 days Delta 25 days 30 days 50 days
a. What is the expected duration for the project? (3 points)
b. What is the variance for the project? (3 points) .
c. What is the standard deviation of the project? (3 points)
d. What is the range of the duration of the project given 3 sigma? (3 points)
Homework Answers
Based on the given data, we tabulate as shown below:

Based on above,
a. The expected duration for the project

As seen from above, the expected duration of the project is 106.5 days
The above table in form of formulas is shown below for better understanding and reference:

b. The variance for the project

As seen from above, the expected duration of the project is 32.03 days
The above table in form of formulas is shown below for better understanding and reference:
c. The standard deviation of the project
Standard Deviation of the project  =
=  =
=  = 5.66
d. The range of the duration of the project given 3 sigma
For 3 sigma, the probability = 99.87%
For probability = 99.87%, z value = 0.9987

0.9987 = 
Required Duration = 112.15 days
Add Answer to:
4. A project has the following tasks and duration estimates
given. These three tasks are done...
Project task E has the following estimates: (1) optimistic time - 10 days, (2) Pessimistic time...
 Project task E has the following estimates: (1) optimistic time - 10 days, (2) Pessimistic time - 20 days, and (3) Most likely time - 12 Days. The standard deviation for time using the beta statistical distribution is ________ days. 2.33 1.5 02 1.67
5. A project has critical path activities A, B, and C. A is the predecessor of B. B is the predec...
 5. A project has critical path activities A, B, and C. A is the predecessor of B. B is the predecessor of C. The duration estimate for activity A, B and C is shown in the following table. Fill the table with mean duration, standard deviation, and variance for activities and the whole project (critical path). Determine what is the probability of completing this project within 80 days? (10 points) Activity Optimistic Pessimistic Most likely Mean Standard Variance deviation duration...
It was determined on the following project that the duration for the tasks contained some uncertainty....
 It was determined on the following project that the duration for the tasks contained some uncertainty. After more research, the optimistic and pessimistic values were determined. 1. a. Calculate the expected time and variance (using the 95 percent level of confidence) for each activity. b. Determine the critical path and time for completion c. Calculate the probably that the project will finish in 30 days. Calculate the probably of completing the project in 27 days. Other than the critical path,...
The table below gives the optimistic, most-likely, and pessimistic time estimates (in weeks) for all activities in a project. (Statistical tables are available in appendix I) Activ Predecessor totm t...
 The table below gives the optimistic, most-likely, and pessimistic time estimates (in weeks) for all activities in a project. (Statistical tables are available in appendix I) Activ Predecessor totm t 2.0 5.0 8.0 3.0 4.0 5.0 4.06.08.0 5.0 6.0 7.0 3.0 6.0 9.0 D, E (i) Calculate the estimated time and variance for each task (ii) Draw the AON diagram and identify the critical path. (iii) What is the expected critical path duration and estimate a standard deviation for the...
(Ch 12) Assume that a task in a project has the following three time estimates: Optimistic...
(Ch 12) Assume that a task in a project has the following three time estimates: Optimistic completion time = 10 weeks Most likely completion time = 14 weeks Pessimistic completion time = 21 weeks Compute the estimated task completion time for this task.
Given the following information about a small project, Task Duration Immediate Estimates Predecessors A &n
Given the following information about a small project, Task Duration Immediate Estimates Predecessors A 2 days None B 5 days A C 4 days B D 9 days A E 4 days B & D F 12 days E & C Draw a network diagram. Identify the critical path, earliest start and finish and slack for each task. Using MS Excel, produce a Gantt chart for this project. What would happen if a new estimate for task D increases...
T 10.4-3. Reconsider Prob. 10.4-2. For each of the 10 activities, here are the three estimates that led to the esti...
 T 10.4-3. Reconsider Prob. 10.4-2. For each of the 10 activities, here are the three estimates that led to the estimates of the mean and variance of the duration of the activity (rounded to the near- est integer) given in the table for Prob. 10.4-2. Optimistic Most L Estimate Pessimistic Activity Estimate Estimate 1.5 months 2 months 3.5 months 1 month 15 months 2 months 21 months 18 months 1.5 months 15 months 0.5 month 1 month 3 months 1...
If the contracted duration for a project with the following network is 120 days, what is the prob...
 If the contracted duration for a project with the following
network is 120 days, what is the probability (in percent) of
meeting the schedule based on PERT analysis? Then, assume that the
owner delays the start by 5 days while keeping the end date as
originally scheduled. What is the probability (in percent) that the
project will still finish at the originally scheduled completion
date? The requested probabilities should be determined based on the
entire network and not just one...
If the contracted duration for a project with the following
network is 120 days, what is the probability (in percent) of
meeting the schedule based on PERT analysis? Then, assume that the
owner delays the start by 5 days while keeping the end date as
originally scheduled. What is the probability (in percent) that the
project will still finish at the originally scheduled completion
date? The requested probabilities should be determined based on the
entire network and not just one...
#1 #2 #3 #4 Time Estimates (in weeks) for SOM's Bus Project is given in the...
 #1
#2
#3
#4
Time Estimates (in weeks) for SOM's Bus Project is given in the following table. Activity Optimistic time Most likely time Pessimistic time A 2 4 6 B 3 5 8 Ic с 4 6 8 D 3 5 10 Please help the project management team to find the standard deviation of Activity D. keep two decimals if not exact, either round up or down is ok. For example, for 0.1346, (0.13 or 13) and (0.14 or.14)...
#1
#2
#3
#4
Time Estimates (in weeks) for SOM's Bus Project is given in the following table. Activity Optimistic time Most likely time Pessimistic time A 2 4 6 B 3 5 8 Ic с 4 6 8 D 3 5 10 Please help the project management team to find the standard deviation of Activity D. keep two decimals if not exact, either round up or down is ok. For example, for 0.1346, (0.13 or 13) and (0.14 or.14)...
For a project, in X day, planned value, earned value and actual cost of the tasks...
 For a project, in X day, planned value, earned value and actual cost of the tasks are given in dollar in the table below. Planned $1000 to complete project. Task Actual Cost Work Performed Budgeted Cost Work Scheduled 50 70 30 100 50 2 3 4 5 Budgeted Cost Work Performed 50 70 30 50 0 Total: 250 a. Find schedule and cost variance. Explain what it means? b. Find schedule and cost performance index. c. Find estimate to complete...
 Project task E has the following estimates: (1) optimistic time - 10 days, (2) Pessimistic time - 20 days, and (3) Most likely time - 12 Days. The standard deviation for time using the beta statistical distribution is ________ days. 2.33 1.5 02 1.67
 5. A project has critical path activities A, B, and C. A is the predecessor of B. B is the predecessor of C. The duration estimate for activity A, B and C is shown in the following table. Fill the table with mean duration, standard deviation, and variance for activities and the whole project (critical path). Determine what is the probability of completing this project within 80 days? (10 points) Activity Optimistic Pessimistic Most likely Mean Standard Variance deviation duration...
 It was determined on the following project that the duration for the tasks contained some uncertainty. After more research, the optimistic and pessimistic values were determined. 1. a. Calculate the expected time and variance (using the 95 percent level of confidence) for each activity. b. Determine the critical path and time for completion c. Calculate the probably that the project will finish in 30 days. Calculate the probably of completing the project in 27 days. Other than the critical path,...
 The table below gives the optimistic, most-likely, and pessimistic time estimates (in weeks) for all activities in a project. (Statistical tables are available in appendix I) Activ Predecessor totm t 2.0 5.0 8.0 3.0 4.0 5.0 4.06.08.0 5.0 6.0 7.0 3.0 6.0 9.0 D, E (i) Calculate the estimated time and variance for each task (ii) Draw the AON diagram and identify the critical path. (iii) What is the expected critical path duration and estimate a standard deviation for the...
 T 10.4-3. Reconsider Prob. 10.4-2. For each of the 10 activities, here are the three estimates that led to the estimates of the mean and variance of the duration of the activity (rounded to the near- est integer) given in the table for Prob. 10.4-2. Optimistic Most L Estimate Pessimistic Activity Estimate Estimate 1.5 months 2 months 3.5 months 1 month 15 months 2 months 21 months 18 months 1.5 months 15 months 0.5 month 1 month 3 months 1...
 If the contracted duration for a project with the following
network is 120 days, what is the probability (in percent) of
meeting the schedule based on PERT analysis? Then, assume that the
owner delays the start by 5 days while keeping the end date as
originally scheduled. What is the probability (in percent) that the
project will still finish at the originally scheduled completion
date? The requested probabilities should be determined based on the
entire network and not just one...
If the contracted duration for a project with the following
network is 120 days, what is the probability (in percent) of
meeting the schedule based on PERT analysis? Then, assume that the
owner delays the start by 5 days while keeping the end date as
originally scheduled. What is the probability (in percent) that the
project will still finish at the originally scheduled completion
date? The requested probabilities should be determined based on the
entire network and not just one...
 #1
#2
#3
#4
Time Estimates (in weeks) for SOM's Bus Project is given in the following table. Activity Optimistic time Most likely time Pessimistic time A 2 4 6 B 3 5 8 Ic с 4 6 8 D 3 5 10 Please help the project management team to find the standard deviation of Activity D. keep two decimals if not exact, either round up or down is ok. For example, for 0.1346, (0.13 or 13) and (0.14 or.14)...
#1
#2
#3
#4
Time Estimates (in weeks) for SOM's Bus Project is given in the following table. Activity Optimistic time Most likely time Pessimistic time A 2 4 6 B 3 5 8 Ic с 4 6 8 D 3 5 10 Please help the project management team to find the standard deviation of Activity D. keep two decimals if not exact, either round up or down is ok. For example, for 0.1346, (0.13 or 13) and (0.14 or.14)...
 For a project, in X day, planned value, earned value and actual cost of the tasks are given in dollar in the table below. Planned $1000 to complete project. Task Actual Cost Work Performed Budgeted Cost Work Scheduled 50 70 30 100 50 2 3 4 5 Budgeted Cost Work Performed 50 70 30 50 0 Total: 250 a. Find schedule and cost variance. Explain what it means? b. Find schedule and cost performance index. c. Find estimate to complete...
Most questions answered within 3 hours.
-
Sketch the crystal field splitting diagram for the low-spin
[Fe(CN)6 ] 4 - ion.
asked 10 seconds ago -
Sketch the homonuclear diatomic MO diagram for
Mo22+. What kind of magnetism does this dimer
exhibit?
asked 20 minutes ago -
Consider a situation where current output (real GDP) is
currently below potential GDP. What type of...
asked 20 minutes ago -
How are the activators and repressors different in eukaryotes vs
prokaryotes for regulation of gene expression?
asked 36 minutes ago -
Task 2.6 : In this exercise, you will create a script to
echo users, based on...
asked 34 minutes ago -
The diameter of the Sun is 1.4x 10⁶ kilometers. (1 km
= 3280 ft) What is...
asked 39 minutes ago -
Calculate the value of the translational partition function of
O2 at 300 K for a volume...
asked 55 minutes ago -
Consider the following tasks, times, and predecessors for an
assembly of set top cable converter boxes:...
asked 53 minutes ago -
10.________ is the proportion of variance in the dependent
variable that is accounted for by the...
asked 1 hour ago -
Find at least three implicit modelling assumptions or other
qualitative factors which are relevant but not...
asked 1 hour ago -
Write a method that determines the key of the successor of the
root node in a...
asked 1 hour ago -
Determine the lattice energy (in kJ/mol) of NaF(s),
using the data provided.
Energy to sublime Na(s)...
asked 1 hour ago