Use the following table to answer the questions below. x y -3 -3 0 0 0...
Use the following table to answer the questions below.
| x | y |
| -3 | -3 |
| 0 | 0 |
| 0 | 3 |
| 2 | 5 |
| 2 | 5 |
a) Find the correlation coefficient r=
b) Find the coefficient of determination ?^2 =
c) Interpret the coefficient of determination
95.0798536569581 OR 90.4017857142857 % of the variation
in x OR y is explained by x
OR y .
*for part c please solve which of the pairs for each set is the right answer for sets that say OR*
Homework Answers
The table for calculations is:

Hence,
a) Correlation coefficient
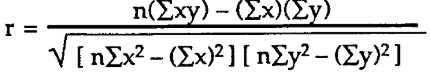
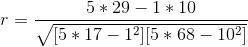
r = 0.9508
b) Coefficient of determination = r2 = (0.9508)2 = 0.9040
c) Interpretation: 90.4017857142857 % of the variation in y is explained by x
Add Answer to:
Use the following table to answer the questions below.
x
y
-3
-3
0
0
0...
Bighorn sheep are beautiful wild animals found throughout the western United States. Let x be the...
Bighorn sheep are beautiful wild animals found throughout the western United States. Let x be the age of a bighorn sheep (in years), and let y be the mortality rate (percent that die) for this age group. For example, x = 1, y = 14 means that 14% of the bighorn sheep between 1 and 2 years old died. A random sample of Arizona bighorn sheep gave the following information: x 1 2 3 4 5 y 15.8 19.3 14.4...
Please show all work AND any calculator functions. The table below summarizes data of heights and...
Please show all work AND any calculator functions. The table below summarizes data of heights and weights of 8 randomly selected adults. Use this information to answer parts a) – h). Height (x) in inches 5.2 5.6 5.8 5.9 5.4 6.1 6.0 5.7 Weight (y) in pounds 119 136 155 185 135 202 194 165 a) Test the claim ρ ≠ 0. Use α = 0.01. • State the hypotheses and label the claim. • State the significance level (α)....
***PLEASE DO ALL THIS IS MY LAST QUESTION OF THE GIVEN AMOUNT OF QUESTIONS :( *** Which value of r indicates a stronger correlation:r 0.751 orr0.896? Explain your reasoning Choose the correct answer...
 ***PLEASE DO ALL THIS IS MY LAST QUESTION OF THE GIVEN AMOUNT OF
QUESTIONS :( ***
Which value of r indicates a stronger correlation:r 0.751 orr0.896? Explain your reasoning Choose the correct answer below. A. r=-0.896 represents a stronger correlation because 0.751 >-0.896. B. r=0.751 represents a stronger correlation because l-08961-10.751. C· r--0 896 represents a stronger correlation because 1-0 8961-10751. D. 0.751 represents a stronger correlation because 0.751> -0.896. The budget (in millions of dollars) and worldwide gross (in...
***PLEASE DO ALL THIS IS MY LAST QUESTION OF THE GIVEN AMOUNT OF
QUESTIONS :( ***
Which value of r indicates a stronger correlation:r 0.751 orr0.896? Explain your reasoning Choose the correct answer below. A. r=-0.896 represents a stronger correlation because 0.751 >-0.896. B. r=0.751 represents a stronger correlation because l-08961-10.751. C· r--0 896 represents a stronger correlation because 1-0 8961-10751. D. 0.751 represents a stronger correlation because 0.751> -0.896. The budget (in millions of dollars) and worldwide gross (in...
1. Use the table below to answer the following questions: (a) Find the value of the...
 1. Use the table below to answer the following questions: (a) Find the value of the linear correlation coefficient. (b) Assuming a 0.01 significance level, find the critical values. (c) Is there sufficient evidence to support the claim of a linear correlation? Explain your reasoning. x | 11-5|-19 41-17 2 ˇ -93-37 | 2가49 | 55 | 3 er
Here is a bivariate data set. x y 44.1 57.5 28.1 30.4 19.3 21.1 19.4 7.6...
Here is a bivariate data set. x y 44.1 57.5 28.1 30.4 19.3 21.1 19.4 7.6 23.9 22.7 23.6 25.6 36.5 43.3 47.5 56 Find the correlation coefficient and report it accurate to three decimal places. r = What proportion of the variation in y can be explained by the variation in the values of x? Report answer as a percentage accurate to one decimal place. r² = %
The table shows the number of goals allowed and the total points earned (2 points for...
 The table shows the number of goals allowed and the total points earned (2 points for a win, and 1 point for an overtime or shoc season. The equation of the regression line is y = -0.600x + 225.826. Use the data to answer the following questions. (a) Find the coefficient of determination, and interpret the result. (b) Find the standard error of the estimate, se, and interpret the result. Goals 212 210 219 223 259 258 273 200 217...
BBA 403 TEST 3: Name: Score:_ SOLVE AND THOROUGHLY INTERPRET YOUR ANSWER 1. A marketing manager conducted a study to determine whether there is a linear relationship between many spent on adverti...
 BBA 403 TEST 3: Name: Score:_ SOLVE AND THOROUGHLY INTERPRET YOUR ANSWER 1. A marketing manager conducted a study to determine whether there is a linear relationship between many spent on advertising and company sales. The data are shown on the table below. Display the data in a scatter plot, calculate the correlation coefficient, state a conclusion, and interpret the result Adverstising Company Expense, (1000s of s) (1000s of ) 2.4 16 2.0 26 14 1.6 2.0 2.2 184 220...
Let x be the age of a licensed driver in years. Let y be the percentage...
Let x be the age of a licensed driver in years. Let y be the percentage of all fatal accidents (for a given age) due to failure to yield the right of way. For example, the first data pair states that 5% of all fatal accidents of 37-year-olds are due to failure to yield the right of way. x 37 47 57 67 77 87 y 5 8 10 17 33 42 Complete parts (a) through (e), given Σx =...
Data from the U.S. Federal Reserve board ( Household Debt Service burder,2002) on consumer debt (...
 Data from the U.S. Federal Reserve board ( Household Debt
Service burder,2002) on consumer debt ( as a percentage of personal
income) and mortgage debt ( also a percentage of personal income)
for selected years are shown in the following tableWhat is the value of
correlation coefficient (r) for this data set? Based on the value
of r, what can you say about their linear relationship?
If Consumer debt is independent (predictor) variable and
household debt is dependent (response) variable....
Data from the U.S. Federal Reserve board ( Household Debt
Service burder,2002) on consumer debt ( as a percentage of personal
income) and mortgage debt ( also a percentage of personal income)
for selected years are shown in the following tableWhat is the value of
correlation coefficient (r) for this data set? Based on the value
of r, what can you say about their linear relationship?
If Consumer debt is independent (predictor) variable and
household debt is dependent (response) variable....
for the following data set answer the following: x=17,13,12,15,16,14,16,16,18,19 y=94,73,59,80,93,85,66,79,77,91 a)prepare a scatter plot b)calculate an...
for the following data set answer the following: x=17,13,12,15,16,14,16,16,18,19 y=94,73,59,80,93,85,66,79,77,91 a)prepare a scatter plot b)calculate an expression for the regression line c)calculate the correlation coefficient r d)calculate the coefficient of determination r^2 e)test the hypothesis (H0=P=0; Ha P does not equal 0) for sigma=0.05 using your determine value of r and online t tables. Please show work!!!
 ***PLEASE DO ALL THIS IS MY LAST QUESTION OF THE GIVEN AMOUNT OF
QUESTIONS :( ***
Which value of r indicates a stronger correlation:r 0.751 orr0.896? Explain your reasoning Choose the correct answer below. A. r=-0.896 represents a stronger correlation because 0.751 >-0.896. B. r=0.751 represents a stronger correlation because l-08961-10.751. C· r--0 896 represents a stronger correlation because 1-0 8961-10751. D. 0.751 represents a stronger correlation because 0.751> -0.896. The budget (in millions of dollars) and worldwide gross (in...
***PLEASE DO ALL THIS IS MY LAST QUESTION OF THE GIVEN AMOUNT OF
QUESTIONS :( ***
Which value of r indicates a stronger correlation:r 0.751 orr0.896? Explain your reasoning Choose the correct answer below. A. r=-0.896 represents a stronger correlation because 0.751 >-0.896. B. r=0.751 represents a stronger correlation because l-08961-10.751. C· r--0 896 represents a stronger correlation because 1-0 8961-10751. D. 0.751 represents a stronger correlation because 0.751> -0.896. The budget (in millions of dollars) and worldwide gross (in...
 1. Use the table below to answer the following questions: (a) Find the value of the linear correlation coefficient. (b) Assuming a 0.01 significance level, find the critical values. (c) Is there sufficient evidence to support the claim of a linear correlation? Explain your reasoning. x | 11-5|-19 41-17 2 ˇ -93-37 | 2가49 | 55 | 3 er
 The table shows the number of goals allowed and the total points earned (2 points for a win, and 1 point for an overtime or shoc season. The equation of the regression line is y = -0.600x + 225.826. Use the data to answer the following questions. (a) Find the coefficient of determination, and interpret the result. (b) Find the standard error of the estimate, se, and interpret the result. Goals 212 210 219 223 259 258 273 200 217...
 BBA 403 TEST 3: Name: Score:_ SOLVE AND THOROUGHLY INTERPRET YOUR ANSWER 1. A marketing manager conducted a study to determine whether there is a linear relationship between many spent on advertising and company sales. The data are shown on the table below. Display the data in a scatter plot, calculate the correlation coefficient, state a conclusion, and interpret the result Adverstising Company Expense, (1000s of s) (1000s of ) 2.4 16 2.0 26 14 1.6 2.0 2.2 184 220...
 Data from the U.S. Federal Reserve board ( Household Debt
Service burder,2002) on consumer debt ( as a percentage of personal
income) and mortgage debt ( also a percentage of personal income)
for selected years are shown in the following tableWhat is the value of
correlation coefficient (r) for this data set? Based on the value
of r, what can you say about their linear relationship?
If Consumer debt is independent (predictor) variable and
household debt is dependent (response) variable....
Data from the U.S. Federal Reserve board ( Household Debt
Service burder,2002) on consumer debt ( as a percentage of personal
income) and mortgage debt ( also a percentage of personal income)
for selected years are shown in the following tableWhat is the value of
correlation coefficient (r) for this data set? Based on the value
of r, what can you say about their linear relationship?
If Consumer debt is independent (predictor) variable and
household debt is dependent (response) variable....
Most questions answered within 3 hours.
-
For the reaction 1N2+3H2-----> 2NH3, would the reaction rate
trend be: delta[NH3]/ delta t = -2...
asked 32 minutes ago -
Within your current/past organization, identify a problem/issue
and format a design to address same. You may...
asked 14 minutes ago -
A sock stuck to the side of a clothes-dryer barrel has a
centripetal acceleration of 24...
asked 1 hour ago -
A perfect gas undergoes an isentropic process such that its
volume doubles. If the ratio of...
asked 1 hour ago -
list the elements in groups 3A to 6A in the same order as in the
periodic...
asked 1 hour ago -
Estimating effect size. Peng and Chen (2014)
evaluated effect size estimates for various tests. In their...
asked 1 hour ago -
Write a script in MySQL that creates and calls a stored
procedure name test. This procedure...
asked 1 hour ago -
If we test the following: H0: μ = 17
vs. H1: μ ≠ 17 and the...
asked 2 hours ago -
in the past year TVG had revenues of 3 million, cost
of goods sold of $25...
asked 2 hours ago -
4) In a polypeptide, which bond cannot rotate because of its
partial double bond character?
The...
asked 2 hours ago -
Assume that in the short run L = 1,000 and K = 100. 1. What is...
asked 2 hours ago -
At a given temperature, 2.06 atm of H2 and 3.7 atm of Br2 are
mixed and...
asked 2 hours ago