


2 to compute the exponential smoothing forecasts for the me series Compute M SE and a forecast or 8 to 2 dec mals Ente negative values as negati e number c. Use α on Time Series Squared Forecast Forecast Month Value Forecast ErrorError 1 21 2 14 3 18 4 13 5 18 6 21 714 Totals MSE The forecast for month 8 d. Compare the three-month moving average approach with he exponential smoothing approach using α- 2. which appears to provide more accurate o ea ts base an M Select your answer e. Use a smoothing constant of α-,4 to compute the MSE. (to 2 decimals) Does a smoothing constant of .2 or .4 appear to provide more accurate forecasts based on MSE? -Select your answer-
d. Compare the three-month moving average approach with the exponential smoothing approach using α = .2, which appears to provide more accurate forecasts based on MSE? -Select your answer The three-month moving average provides a better forecast since it has a smaller MSE The exponential smoothing approach provides a better forecast since it has a smaller MSE The three-month moving average provides a better forecast since it has a larger MSE
e. Use a smoothing constant of α-.4 to compute the MSE. (to 2 decimals) Does a smoothing constant of .2 or .4 appear to provide more accurate forecasts based on MSE? -Select your answer - .2 .4
Homework Answers
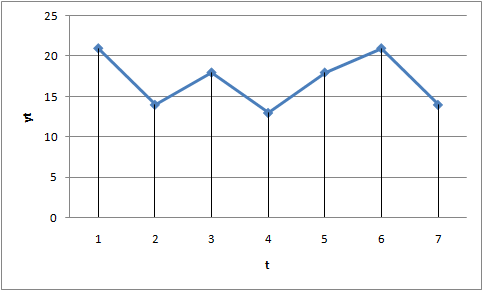
(a) right choice is first.
there is seasonality pattern in the data ( please give the options for appropriate answer)
(b)
| t | yt | Forecast | forecast error | squared forecast error | |
| 1 | 21 | ||||
| 2 | 14 | ||||
| 3 | 18 | ||||
| 4 | 13 | 17.6667 | -4.6667 | 21.7778 | |
| 5 | 18 | 15.0000 | 3.0000 | 9.0000 | |
| 6 | 21 | 16.3333 | 4.6667 | 21.7778 | |
| 7 | 14 | 17.3333 | -3.3333 | 11.1111 | |
| total | 63.6667 | ||||
MSE=SQRT(63.6667/4)=3.9896
forecast for month 8=(18+21+14)/3=17.6667
(c)
| alpha= | 0.2 | ||||
| t | Yt | Ft=alpha*Y(t-1)+(1-alpha)*F(t-1) | forecast error | squared forecast error | |
| 1 | 21 | ||||
| 2 | 14 | 21.0000 | -7.0000 | 49.0000 | |
| 3 | 18 | 19.6000 | -1.6000 | 2.5600 | |
| 4 | 13 | 19.2800 | -6.2800 | 39.4384 | |
| 5 | 18 | 18.0240 | -0.0240 | 0.0006 | |
| 6 | 21 | 18.0192 | 2.9808 | 8.8852 | |
| 7 | 14 | 18.6154 | -4.6154 | 21.3015 | |
| 8 | 17.6923 | total= | 121.1857 | ||
| 9 | MSE= | 4.4942 | |||
MSE=sqrt(121.1857/6)=4.4942
forecast for the month 8=17.6923
(d) right choice is first.
since the 3-months moving average MSE is less than exponential smoothing (alpha=0.2 )
(e) alpha=0.4 is better ( than alpha=0.2).
| alpha= | 0.4 | ||||
| t | Yt | Ft=alpha*Y(t-1)+(1-alpha)*F(t-1) | forecast error | squared forecast error | |
| 1 | 21 | ||||
| 2 | 14 | 21.0000 | -7.0000 | 49.0000 | |
| 3 | 18 | 18.2000 | -0.2000 | 0.0400 | |
| 4 | 13 | 18.1200 | -5.1200 | 26.2144 | |
| 5 | 18 | 16.0720 | 1.9280 | 3.7172 | |
| 6 | 21 | 16.8432 | 4.1568 | 17.2790 | |
| 7 | 14 | 18.5059 | -4.5059 | 20.3033 | |
| 8 | 16.7036 | total= | 116.5539 | ||
| 9 | MSE= | 4.4075 | |||
Add Answer to:
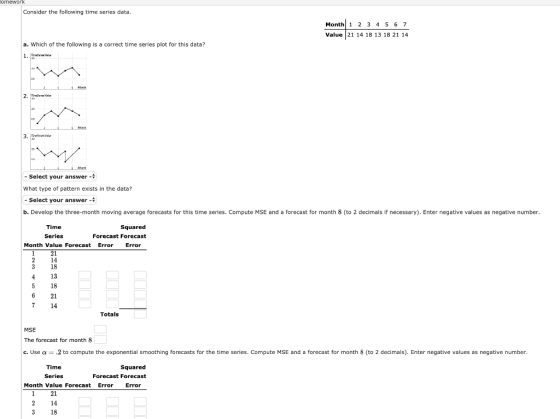
Omework Consider the following time series data Month 1 2 3 4 5 6 7 Value 21 14 18 13 18 21 14 a....
Consider the following time series data. Week 1 2 3 4 5 6 Value 19 13 16 12 18 14 a. Whic...
Consider the following time series data. Week 1 2 3 4 5 6 Value 19 13 16 12 18 14 a. Which of the following is a correct time series plot for this data? - Select your answer -plot #1plot #2plot #3Item 1 What type of pattern exists in the data? - Select your answer -VerticalHorizontalScatterItem 2 b. Develop the three-week moving average forecasts for this time series. Compute MSE and a forecast for week (to 2 decimals if necessary)....
Consider the following time series data.
 Please help :) a. Which of the following is a correct time series plot for this data? b. Develop the three-month moving average forecasts for this time series. Compute MSE and a forecast for month 8 (to 2 decimals if necessary). c. Use α-.2 to compute the exponential smoothing forecasts for the time series. Compute MSE and a forecast for month 8 (to 2 decimals). Enter negative values as negative number. d. Compare the three-month moving average approach with the exponential smoothing approach using...
Consider the following time series data Week 1 2 3 4 5 6 Value 19 14...
 Consider the following time series data Week 1 2 3 4 5 6 Value 19 14 16 12 18 15 a. Which of the following is a correct time series plot for this data? 1 Time eries Value 15 10 Week 2 TimeSeries Value 15 10 5 Week 4 3 TimeSeries Value 15 10 -5 Week 4 5 Select your answer What type of pattern exists in the data? What type of pattern exists in the data? Horizontal b. Develop...
Consider the following time series data
 Consider the following time series dataa. Which of the following is a correct time series plot for this data?b. Develop the three-week moving average forecasts for this time series. Compute MSE and a forecast for week 7 (to 2 decimals if necessary) c. Use α = .2 to compute the exponential smoothing forecasts for the time series. Compute MSE and a forecast for week 7 ( 2 decimals). d. Compare the three-week moving average approach with the exponential smoothing approach using α-.2,...
Consider the following time series data. Week 1 2 3 4 5 6 Value 19 11 16 1017 15 (a) Construct a ...
 Consider the following time series data. Week 1 2 3 4 5 6 Value 19 11 16 1017 15 (a) Construct a time series plot. 20 20 20 18 16 14 12 10 c 14 12 12 0 23 4 5 67 0 23 4 5 67 Week Weck Week 20 18 0 1 2345 6 7 Week What type of pattern exists in the data? The data appear to follow a seasonal pattern. The data appear to follow a...
Please help Consider the following time series data. Week 1 N 3 4 5 6 Value...
 Please help
Consider the following time series data. Week 1 N 3 4 5 6 Value 19 11 13 10 14 12 (a) Construct a time series plot. 20 18 20 18 14 12 10 Week 3 4 Week D 20 18+ 16 Time Series Value Time Series Value 5 Week 0 Wook What type of pattem exists in the data? The data appear to follow a cyclical pattern. The data appear to follow a trend pattem. The data appear...
Please help
Consider the following time series data. Week 1 N 3 4 5 6 Value 19 11 13 10 14 12 (a) Construct a time series plot. 20 18 20 18 14 12 10 Week 3 4 Week D 20 18+ 16 Time Series Value Time Series Value 5 Week 0 Wook What type of pattem exists in the data? The data appear to follow a cyclical pattern. The data appear to follow a trend pattem. The data appear...
Homework Consider the following time series data. Week Value a. Which of the following is a...
 Homework Consider the following time series data. Week Value a. Which of the following is a correct time series plot for this data? 1 18 2 14 3 17 4 12 5 17 6 15 TimeSeries Value 115 Week TimeSeries Value 3 4 5 Week 2 TimeSeries Value 15 3 4 . 5 Week plot #1 What type of pattern exists in the data? Horizontal a Search this course mework Week plot 01 What type of pattern exists in the...
2. Consider the following time series data: 2Month Value 20 15 23 6 4 13 6 18 25 10 8 10 9 24 12 10 21 13 19 14 15...
 2. Consider the following time series data: 2Month Value 20 15 23 6 4 13 6 18 25 10 8 10 9 24 12 10 21 13 19 14 15 la. Use a α # 0.25 to compute the exponential smoothing values for the time series. Compute MSE and a forecast for Month 12. b. Compare the two-month moving average forecast with the exponential smoothing forecast using a 0.25. Which appears to 17 provide the better forecast based on MSE?...
Consider the following time series data: Month 1 2 3 4 5 6 7 Value 24...
Consider the following time series data: Month 1 2 3 4 5 6 7 Value 24 13 21 14 20 23 15 (c) Use α = 0.2 to compute the exponential smoothing values for the time series. Compute MSE and a forecast for month 8. If required, round your answers to two decimal places. Do not round intermediate calculation. MSE: The forecast for month 8: (e) Use trial and error to find a value of the exponential smoothing coefficient α...
 Please help :) a. Which of the following is a correct time series plot for this data? b. Develop the three-month moving average forecasts for this time series. Compute MSE and a forecast for month 8 (to 2 decimals if necessary). c. Use α-.2 to compute the exponential smoothing forecasts for the time series. Compute MSE and a forecast for month 8 (to 2 decimals). Enter negative values as negative number. d. Compare the three-month moving average approach with the exponential smoothing approach using...
 Consider the following time series data Week 1 2 3 4 5 6 Value 19 14 16 12 18 15 a. Which of the following is a correct time series plot for this data? 1 Time eries Value 15 10 Week 2 TimeSeries Value 15 10 5 Week 4 3 TimeSeries Value 15 10 -5 Week 4 5 Select your answer What type of pattern exists in the data? What type of pattern exists in the data? Horizontal b. Develop...
 Consider the following time series dataa. Which of the following is a correct time series plot for this data?b. Develop the three-week moving average forecasts for this time series. Compute MSE and a forecast for week 7 (to 2 decimals if necessary) c. Use α = .2 to compute the exponential smoothing forecasts for the time series. Compute MSE and a forecast for week 7 ( 2 decimals). d. Compare the three-week moving average approach with the exponential smoothing approach using α-.2,...
 Consider the following time series data. Week 1 2 3 4 5 6 Value 19 11 16 1017 15 (a) Construct a time series plot. 20 20 20 18 16 14 12 10 c 14 12 12 0 23 4 5 67 0 23 4 5 67 Week Weck Week 20 18 0 1 2345 6 7 Week What type of pattern exists in the data? The data appear to follow a seasonal pattern. The data appear to follow a...
 Please help
Consider the following time series data. Week 1 N 3 4 5 6 Value 19 11 13 10 14 12 (a) Construct a time series plot. 20 18 20 18 14 12 10 Week 3 4 Week D 20 18+ 16 Time Series Value Time Series Value 5 Week 0 Wook What type of pattem exists in the data? The data appear to follow a cyclical pattern. The data appear to follow a trend pattem. The data appear...
Please help
Consider the following time series data. Week 1 N 3 4 5 6 Value 19 11 13 10 14 12 (a) Construct a time series plot. 20 18 20 18 14 12 10 Week 3 4 Week D 20 18+ 16 Time Series Value Time Series Value 5 Week 0 Wook What type of pattem exists in the data? The data appear to follow a cyclical pattern. The data appear to follow a trend pattem. The data appear...
 Homework Consider the following time series data. Week Value a. Which of the following is a correct time series plot for this data? 1 18 2 14 3 17 4 12 5 17 6 15 TimeSeries Value 115 Week TimeSeries Value 3 4 5 Week 2 TimeSeries Value 15 3 4 . 5 Week plot #1 What type of pattern exists in the data? Horizontal a Search this course mework Week plot 01 What type of pattern exists in the...
 2. Consider the following time series data: 2Month Value 20 15 23 6 4 13 6 18 25 10 8 10 9 24 12 10 21 13 19 14 15 la. Use a α # 0.25 to compute the exponential smoothing values for the time series. Compute MSE and a forecast for Month 12. b. Compare the two-month moving average forecast with the exponential smoothing forecast using a 0.25. Which appears to 17 provide the better forecast based on MSE?...
Most questions answered within 3 hours.
-
What do you think every computer science department must teach,
concerning the fact that technology rapidly...
asked 26 seconds ago -
home / study / science / physics / physics questions and answers
/ 2. an object...
asked 2 minutes ago -
An open cart is travelling at constant speed on a level surface.
A load of coal...
asked 6 minutes ago -
A ski-jumper leaves the ski track moving in the horizontal
direction with a speed of 25.0...
asked 15 minutes ago -
A commercial lubricant, Dubdeefordy, has K = SN/SM = 13.1 for
immiscible solvent M and N....
asked 38 minutes ago -
Are there any potential drawback to the job-crafting approach?
If so, how can they be minimized?
asked 15 minutes ago -
12. To accommodate growth until a new version of IP could be
standardized and adopted, a...
asked 20 minutes ago -
Create a separation scheme flow chart/diagram to isolate methyl
salicylate from a product mixture containing the...
asked 20 minutes ago -
5. The animals of which phylum use a water vascular system in
locomotion, feeding and gas...
asked 45 minutes ago -
*HOW DO I CHANGE THIS FROM A VOID FUNCTION TO A NON-VOID
WITH PARAMETERS?*
#include<iostream>
#include<fstream>...
asked 34 minutes ago -
I have a matrix, A= rand(2,3,2) ans(:,:,1) = 0.8116 0.3507
0.8759 0.5328 0.9390 0.5502 ans(:,:,2) =...
asked 37 minutes ago -
Examine several recent mergers and suggest the principal motives
for merging in each case. Discuss three...
asked 40 minutes ago