 table
4
table
4 protein
concentrations
protein
concentrationsHomework Answers
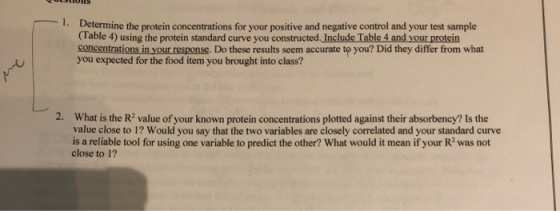
The standard curve fits the straight line equation of Y = 0.106x + 0.0433.
This equation can be used to find value to X-ordinates (protein concentrations) given Y co-ordinate by transforming in the following manner; X = (y – 0.0433)/0.106
For sample with abs 0.071, protein concentration= (0.071 -0.0433)/0.106 = 0.26
For sample with abs 2.71, protein concentration= (2.71 -0.0433)/0.106 = 25.15
For sample with abs 0.0117, protein concentration= (0.0117 -0.0433)/0.106 = -0.298; gives negative vale, means the protein concentration is very low or doesn’t have protein as compared to the standard concentrations.
These results may not be accurate as the absorbance values do not lie in the linear range of the standard curve (absorbance values range from 0.15 to 1).
|
Estimated protein concentration |
Absorbance |
|
-0.298 |
0.0117 |
|
0.26 |
0.071 |
|
25.15 |
2.71 |
The standard curve has an R2 value of 0.98 which is very close to 1. An R2 value closer to 1 indicates that there is a linear relationship between variables of x-axis and y-axis. If x-axis variable changes by a factor, we can predict the value of y-axis as they have linear relationship. This will serve as a reliable tool to predict the unknown protein concentrations when absorbance values in the range are given.
If R2 is not closer to 1 that indicates that we are not sure of a linear relation between x-axis (protein concentration) and y-axis (absorbance) variables. We cannot reliably predict the change in one variable given a respective change in other one.
Add Answer to:
please answer 1 and 2
table
4
protein
concentrations
1. Determine the protein concentrations for your...
1. You want to prepare a 1:50 dilution of your protein extract in a total volume...
1. You want to prepare a 1:50 dilution of your protein extract in a total volume of 1000 uL. You will need ___ uL of protein extract and ___ uL of water. 2. You are provided with a solution of BSA that is 100 ug/mL and make a 10-2 dilution? What is the resulting concentration of the DILUTED BSA? 3. Which of the following statements about enzymes is true? Select one: a. Enzymes increase the rate of a chemical reaction...
Table 5. Drink mix concentrations and absorbances for constructing a standard curve Concentration Concentration Absorbance (mm)...
 Table 5. Drink mix concentrations and absorbances for constructing a standard curve Concentration Concentration Absorbance (mm) (M) Sample 1 0.51 Sample 2 Sample 3 Sample 4 How do I calculate to find (M)?
5. The following data were obtained when Bio 106 students created solutions of the following concentrations...
 5. The following data were obtained when Bio 106 students created solutions of the following concentrations (column 1), These students then placed three different samples of each concentration in a spectrophotometer and measured the absorbance. The following data table was created by these students. Create a standard curve from the data in the following table. Be sure to calculate the average absorbance for each concentration (round to two decimal places). After you have created the table, answer the following questions....
Table 3: Absorbance for varying concentrations of Co(NO3)2 at max wavelength Sample Number Concentration (mM) Absorbance...
 Table 3: Absorbance for varying
concentrations of Co(NO3)2 at max
wavelength
Sample Number
Concentration (mM)
Absorbance
0
0 mM
0.00
1
30 mM
0.13
2
60 mM
0.27
3
90mM
0.40
4
120mM
0.53
5
150 mM
0.67
Answer the following questions based on your calibration curve
Calculate the
l value from the slope of your graph
Table 3: Absorbance for varying
concentrations of Co(NO3)2 at max
wavelength
Sample Number
Concentration (mM)
Absorbance
0
0 mM
0.00
1
30 mM
0.13
2
60 mM
0.27
3
90mM
0.40
4
120mM
0.53
5
150 mM
0.67
Answer the following questions based on your calibration curve
Calculate the
l value from the slope of your graph
PROCEDURE Table 4.1: Dilutions of Albumin for Standard Curve Determination. SAMPLE NUMBER VOLUME OF 0.9% NACL...
 PROCEDURE Table 4.1: Dilutions of Albumin for Standard Curve Determination. SAMPLE NUMBER VOLUME OF 0.9% NACL (mL) VOLUME OF 10 mg/ml ALBUMIN STOCK SOLUTION (mL) VOLUME OF BIURET REAGENT (mL) TOTAL VOLUME IN EACH TUBE ABSORBANCE READING ALBUMIN CONCENTRATION IN SOLUTION 1 (Blank) 1.0 mL OmL 4.0 mL 0.8 mL 0.2 mL 4.0 mL .4 0.6 mL 0.4 mL 4.0 mL 5 mL 5ml sme 5mL 5ml 5mL .228 .088 1 0.271 773 1.444 11827 0.4 mL 0.6 mL 4.0...
please help answer questions for mixture 1 AND mixture 2 thank you! Table 23.1 Test Tube...
 please help answer questions for mixture 1 AND mixture 2 thank
you!
Table 23.1 Test Tube Number 1 2 3 4 5 5,00 1.00 5.00 2.00 Volume Fe(NO), solution (ml.) Volume KSCN solution (ml.) Volume H,O (ml.) 5.00 3.00 2.00 5.00 4.00 5.00 5.00 0.00 4.00 3.00 1.00 Mixture 2 3 4 5 Absorbance 0.079 0.165 0.246 0.311 0.400 In order to convert the absorbance values provided below into equilibrium concentrations of FeSCN?, you will need to know the slope...
please help answer questions for mixture 1 AND mixture 2 thank
you!
Table 23.1 Test Tube Number 1 2 3 4 5 5,00 1.00 5.00 2.00 Volume Fe(NO), solution (ml.) Volume KSCN solution (ml.) Volume H,O (ml.) 5.00 3.00 2.00 5.00 4.00 5.00 5.00 0.00 4.00 3.00 1.00 Mixture 2 3 4 5 Absorbance 0.079 0.165 0.246 0.311 0.400 In order to convert the absorbance values provided below into equilibrium concentrations of FeSCN?, you will need to know the slope...
Please answer #2. I'm unsure how its done ete od SOCK Solutions (the concentrations are known...
 Please answer #2. I'm unsure how its done
ete od SOCK Solutions (the concentrations are known you prepare will be used in assessing concent (0.07wv) to be used in developing a spectrophotometric assay for this drug. The standard curve your disposal a primary standard solution of the drug in sal w be used in assessing concentrations of the drug in samples having unknown concentrations. You have at this STD). The linear range of the assay for this drug a primary...
Please answer #2. I'm unsure how its done
ete od SOCK Solutions (the concentrations are known you prepare will be used in assessing concent (0.07wv) to be used in developing a spectrophotometric assay for this drug. The standard curve your disposal a primary standard solution of the drug in sal w be used in assessing concentrations of the drug in samples having unknown concentrations. You have at this STD). The linear range of the assay for this drug a primary...
Question 14 4 pts A protein assay was performed using the Bradford Reagent to determine the...
 Question 14 4 pts A protein assay was performed using the Bradford Reagent to determine the protein concentrations of a series of pet food extract samples. The BSA Standard Curve had a slope of 0.0173 Data obtained for the pet food are shown in the table below. Tubes 1-2 contained different volumes of the pet food extract. Tube # Volume Sample (UL) A(595) Volume Volume Water Reagent (3.0 (L) mL) 803 503 1 2 20 50 0.293 0.657 What is...
4. (a) Determine the experimental concentration of protein in the unknown solution in mg/mL using the...
 4. (a) Determine the experimental concentration of protein in the unknown solution in mg/mL using the Part II Data Table and the equation on page 2 for the absorbance assay at 280 nm. Hint: Convert the molar concentration (M or moles/liter) of BSA from absorbance assay at 280 nm method to mg/mL, assume that the molecular weight of BSA = 66.5 kDa [7 points 6500 g/mol Post-lab 10 Report Form: Determination the Concentration of a Protein You must show your...
1. You have generated the following standard curve after a Bradford Assay to measure Absorbance vs...
 1. You have generated the following standard curve after a Bradford Assay to measure Absorbance vs samples of known BSA concentrations. Now you need to determine the amount of protein in two mitochondria samples taken from fish, one taken from fish under normal conditions and the other taken from fish under oxidative stress. The absorbance reading for the normal fish fraction was A595=175, and the absorbance reading for the stressed fish fraction was A595= 275 Bradford Assay Standard Curve y...
 Table 5. Drink mix concentrations and absorbances for constructing a standard curve Concentration Concentration Absorbance (mm) (M) Sample 1 0.51 Sample 2 Sample 3 Sample 4 How do I calculate to find (M)?
 5. The following data were obtained when Bio 106 students created solutions of the following concentrations (column 1), These students then placed three different samples of each concentration in a spectrophotometer and measured the absorbance. The following data table was created by these students. Create a standard curve from the data in the following table. Be sure to calculate the average absorbance for each concentration (round to two decimal places). After you have created the table, answer the following questions....
 Table 3: Absorbance for varying
concentrations of Co(NO3)2 at max
wavelength
Sample Number
Concentration (mM)
Absorbance
0
0 mM
0.00
1
30 mM
0.13
2
60 mM
0.27
3
90mM
0.40
4
120mM
0.53
5
150 mM
0.67
Answer the following questions based on your calibration curve
Calculate the
l value from the slope of your graph
Table 3: Absorbance for varying
concentrations of Co(NO3)2 at max
wavelength
Sample Number
Concentration (mM)
Absorbance
0
0 mM
0.00
1
30 mM
0.13
2
60 mM
0.27
3
90mM
0.40
4
120mM
0.53
5
150 mM
0.67
Answer the following questions based on your calibration curve
Calculate the
l value from the slope of your graph
 PROCEDURE Table 4.1: Dilutions of Albumin for Standard Curve Determination. SAMPLE NUMBER VOLUME OF 0.9% NACL (mL) VOLUME OF 10 mg/ml ALBUMIN STOCK SOLUTION (mL) VOLUME OF BIURET REAGENT (mL) TOTAL VOLUME IN EACH TUBE ABSORBANCE READING ALBUMIN CONCENTRATION IN SOLUTION 1 (Blank) 1.0 mL OmL 4.0 mL 0.8 mL 0.2 mL 4.0 mL .4 0.6 mL 0.4 mL 4.0 mL 5 mL 5ml sme 5mL 5ml 5mL .228 .088 1 0.271 773 1.444 11827 0.4 mL 0.6 mL 4.0...
 please help answer questions for mixture 1 AND mixture 2 thank
you!
Table 23.1 Test Tube Number 1 2 3 4 5 5,00 1.00 5.00 2.00 Volume Fe(NO), solution (ml.) Volume KSCN solution (ml.) Volume H,O (ml.) 5.00 3.00 2.00 5.00 4.00 5.00 5.00 0.00 4.00 3.00 1.00 Mixture 2 3 4 5 Absorbance 0.079 0.165 0.246 0.311 0.400 In order to convert the absorbance values provided below into equilibrium concentrations of FeSCN?, you will need to know the slope...
please help answer questions for mixture 1 AND mixture 2 thank
you!
Table 23.1 Test Tube Number 1 2 3 4 5 5,00 1.00 5.00 2.00 Volume Fe(NO), solution (ml.) Volume KSCN solution (ml.) Volume H,O (ml.) 5.00 3.00 2.00 5.00 4.00 5.00 5.00 0.00 4.00 3.00 1.00 Mixture 2 3 4 5 Absorbance 0.079 0.165 0.246 0.311 0.400 In order to convert the absorbance values provided below into equilibrium concentrations of FeSCN?, you will need to know the slope...
 Please answer #2. I'm unsure how its done
ete od SOCK Solutions (the concentrations are known you prepare will be used in assessing concent (0.07wv) to be used in developing a spectrophotometric assay for this drug. The standard curve your disposal a primary standard solution of the drug in sal w be used in assessing concentrations of the drug in samples having unknown concentrations. You have at this STD). The linear range of the assay for this drug a primary...
Please answer #2. I'm unsure how its done
ete od SOCK Solutions (the concentrations are known you prepare will be used in assessing concent (0.07wv) to be used in developing a spectrophotometric assay for this drug. The standard curve your disposal a primary standard solution of the drug in sal w be used in assessing concentrations of the drug in samples having unknown concentrations. You have at this STD). The linear range of the assay for this drug a primary...
 Question 14 4 pts A protein assay was performed using the Bradford Reagent to determine the protein concentrations of a series of pet food extract samples. The BSA Standard Curve had a slope of 0.0173 Data obtained for the pet food are shown in the table below. Tubes 1-2 contained different volumes of the pet food extract. Tube # Volume Sample (UL) A(595) Volume Volume Water Reagent (3.0 (L) mL) 803 503 1 2 20 50 0.293 0.657 What is...
 4. (a) Determine the experimental concentration of protein in the unknown solution in mg/mL using the Part II Data Table and the equation on page 2 for the absorbance assay at 280 nm. Hint: Convert the molar concentration (M or moles/liter) of BSA from absorbance assay at 280 nm method to mg/mL, assume that the molecular weight of BSA = 66.5 kDa [7 points 6500 g/mol Post-lab 10 Report Form: Determination the Concentration of a Protein You must show your...
 1. You have generated the following standard curve after a Bradford Assay to measure Absorbance vs samples of known BSA concentrations. Now you need to determine the amount of protein in two mitochondria samples taken from fish, one taken from fish under normal conditions and the other taken from fish under oxidative stress. The absorbance reading for the normal fish fraction was A595=175, and the absorbance reading for the stressed fish fraction was A595= 275 Bradford Assay Standard Curve y...
Most questions answered within 3 hours.
-
In the Chesapeake region during the mid-17th
century how similar was the experience of an independent...
asked 1 hour ago -
. A 2.50 M stock solution was used to prepare a dilute NaOH
solution with a...
asked 2 hours ago -
Write a program that reads in a text file, infile.txt, and
prints out all the lines...
asked 4 hours ago -
Which of the following orbits have a total of zero energy (based
on the common convention)?...
asked 4 hours ago -
Find the expected count and the contribution to the chi-square
statistic for the (Group 1, No)...
asked 6 hours ago -
Suppose you are purchasing a meal and with every meal a you
receive one of 10...
asked 5 hours ago -
A 75.0 kg 0erson is riding in a car moving at 20.0 m/s when the
car...
asked 5 hours ago -
What does Δp = QR mean in words?
Pushing a viscous fluid through a pipe requires...
asked 6 hours ago -
We know that system.out.println (“object number” + n ); is
legal.String name; int n; name =...
asked 6 hours ago -
Come up with a real-life problem (open-ended) and solve it by
designing and writing a Java...
asked 6 hours ago -
Power Music owns five music stores, where it sells music,
instruments, and supplies. In addition, it...
asked 6 hours ago -
True or false and
why:
Given the following sequence of numbers to be
inserted {4,5,6,1,2,3,8,7}, the...
asked 6 hours ago